Page 90 - Statistics for Environmental Engineers
P. 90

L1592_Frame_C09  Page 83  Tuesday, December 18, 2001  1:45 PM


                                                    Bias – none
                                           Measured on the High Level Specimen  24  Precision – good
                                              22
                                              20
                                              18
                                              16


                                           Measured on the High Level Specimen  24  Biased   Precision – poor
                                              22
                                              20
                                              18
                                                  Biased
                                              16
                                                  6  8  10  12  14  6  Bias – poor 12  14
                                                                       8
                                                                          10
                                                   Measured on the   Measured on the
                                                 Low Level Specimen  Low Level Specimen
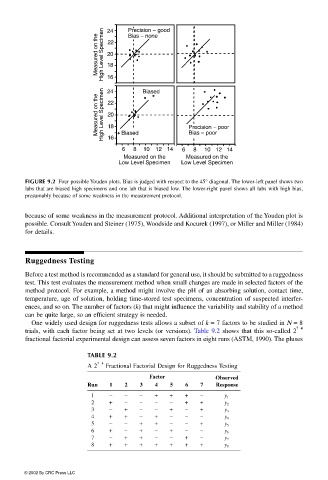
                       FIGURE 9.2 Four possible Youden plots. Bias is judged with respect to the 45° diagonal. The lower-left panel shows two
                       labs that are biased high specimens and one lab that is biased low. The lower-right panel shows all labs with high bias,
                       presumably because of some weakness in the measurement protocol.

                       because of some weakness in the measurement protocol. Additional interpretation of the Youden plot is
                       possible. Consult Youden and Steiner (1975), Woodside and Kocurek (1997), or Miller and Miller (1984)
                       for details.


                       Ruggedness Testing
                       Before a test method is recommended as a standard for general use, it should be submitted to a ruggedness
                       test. This test evaluates the measurement method when small changes are made in selected factors of the
                       method protocol. For example, a method might involve the pH of an absorbing solution, contact time,
                       temperature, age of solution, holding time-stored test specimens, concentration of suspected interfer-
                       ences, and so on. The number of factors (k) that might influence the variability and stability of a method
                       can be quite large, so an efficient strategy is needed.
                        One widely used design for ruggedness tests allows a subset of k = 7 factors to be studied in Ν = 8
                                                                                                    7−4
                       trials, with each factor being set at two levels (or versions). Table 9.2 shows that this so-called 2
                       fractional factorial experimental design can assess seven factors in eight runs (ASTM, 1990). The pluses

                                        TABLE 9.2
                                           7– 4
                                        A 2   Fractional Factorial Design for Ruggedness Testing
                                                           Factor            Observed
                                        Run    1   2   3    4   5   6    7   Response
                                         1     −   −   −    +   +   +    −     y 1
                                         2     +   −   −    −   −   +    +     y 2
                                         3     −   +   −    −   +   −    +     y 3
                                         4     +   +   −    +   −   −    −     y 4
                                         5     −   −   +    +   −   −    +     y 5
                                         6     +   −   +    −   +   −    −     y 6
                                         7     −   +   +    −   −   +    −     y 7
                                         8     +   +   +    +   +   +    +     y 8


                      © 2002 By CRC Press LLC
   85   86   87   88   89   90   91   92   93   94   95