
Page 197 - Steam Turbines Design, Applications, and Rerating
P. 197
176 Chapter Ten
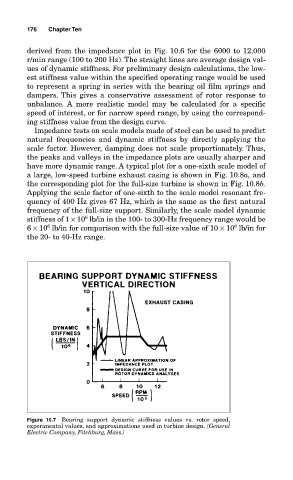
derived from the impedance plot in Fig. 10.6 for the 6000 to 12,000
r/min range (100 to 200 Hz). The straight lines are average design val-
ues of dynamic stiffness. For preliminary design calculations, the low-
est stiffness value within the specified operating range would be used
to represent a spring in series with the bearing oil film springs and
dampers. This gives a conservative assessment of rotor response to
unbalance. A more realistic model may be calculated for a specific
speed of interest, or for narrow speed range, by using the correspond-
ing stiffness value from the design curve.
Impedance tests on scale models made of steel can be used to predict
natural frequencies and dynamic stiffness by directly applying the
scale factor. However, damping does not scale proportionately. Thus,
the peaks and valleys in the impedance plots are usually sharper and
have more dynamic range. A typical plot for a one-sixth scale model of
a large, low-speed turbine exhaust casing is shown in Fig. 10.8a, and
the corresponding plot for the full-size turbine is shown in Fig. 10.8b.
Applying the scale factor of one-sixth to the scale model resonant fre-
quency of 400 Hz gives 67 Hz, which is the same as the first natural
frequency of the full-size support. Similarly, the scale model dynamic
6
stiffness of 1 × 10 lb/in in the 100- to 300-Hz frequency range would be
6
6
6 × 10 lb/in for comparison with the full-size value of 10 × 10 lb/in for
the 20- to 40-Hz range.
Figure 10.7 Bearing support dynamic stiffness values vs. rotor speed,
experimental values, and approximations used in turbine design. (General
Electric Company, Fitchburg, Mass.)