
Page 223 - Steam Turbines Design, Applications, and Rerating
P. 223
202 Chapter Eleven
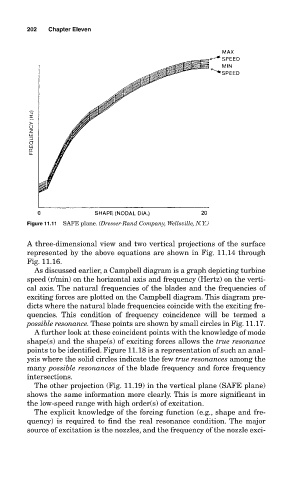
Figure 11.11 SAFE plane. (Dresser-Rand Company, Wellsville, N.Y.)
A three-dimensional view and two vertical projections of the surface
represented by the above equations are shown in Fig. 11.14 through
Fig. 11.16.
As discussed earlier, a Campbell diagram is a graph depicting turbine
speed (r/min) on the horizontal axis and frequency (Hertz) on the verti-
cal axis. The natural frequencies of the blades and the frequencies of
exciting forces are plotted on the Campbell diagram. This diagram pre-
dicts where the natural blade frequencies coincide with the exciting fre-
quencies. This condition of frequency coincidence will be termed a
possible resonance. These points are shown by small circles in Fig. 11.17.
A further look at these coincident points with the knowledge of mode
shape(s) and the shape(s) of exciting forces allows the true resonance
points to be identified. Figure 11.18 is a representation of such an anal-
ysis where the solid circles indicate the few true resonances among the
many possible resonances of the blade frequency and force frequency
intersections.
The other projection (Fig. 11.19) in the vertical plane (SAFE plane)
shows the same information more clearly. This is more significant in
the low-speed range with high order(s) of excitation.
The explicit knowledge of the forcing function (e.g., shape and fre-
quency) is required to find the real resonance condition. The major
source of excitation is the nozzles, and the frequency of the nozzle exci-