
Page 145 -
P. 145
CHAPTER 4 • THE INTERNAL ASSESSMENT 111
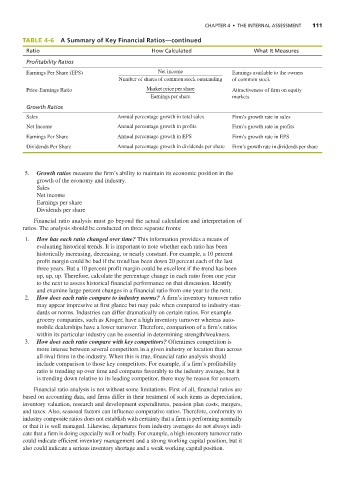
TABLE 4-6 A Summary of Key Financial Ratios—continued
Ratio How Calculated What It Measures
Profitability Ratios
Earnings Per Share (EPS) Net income Earnings available to the owners
Number of shares of common stock ooutstanding of common stock
Price-Earnings Ratio Market price per share Attractiveness of firm on equity
Earnings per share markets
Growth Ratios
Sales Annual percentage growth in total sales Firm’s growth rate in sales
Net Income Annual percentage growth in profits Firm’s growth rate in profits
Earnings Per Share Annual percentage growth in EPS Firm’s growth rate in EPS
Dividends Per Share Annual percentage growth in dividends per share Firm’s growth rate in dividends per share
5. Growth ratios measure the firm’s ability to maintain its economic position in the
growth of the economy and industry.
Sales
Net income
Earnings per share
Dividends per share
Financial ratio analysis must go beyond the actual calculation and interpretation of
ratios. The analysis should be conducted on three separate fronts:
1. How has each ratio changed over time? This information provides a means of
evaluating historical trends. It is important to note whether each ratio has been
historically increasing, decreasing, or nearly constant. For example, a 10 percent
profit margin could be bad if the trend has been down 20 percent each of the last
three years. But a 10 percent profit margin could be excellent if the trend has been
up, up, up. Therefore, calculate the percentage change in each ratio from one year
to the next to assess historical financial performance on that dimension. Identify
and examine large percent changes in a financial ratio from one year to the next.
2. How does each ratio compare to industry norms? A firm’s inventory turnover ratio
may appear impressive at first glance but may pale when compared to industry stan-
dards or norms. Industries can differ dramatically on certain ratios. For example
grocery companies, such as Kroger, have a high inventory turnover whereas auto-
mobile dealerships have a lower turnover. Therefore, comparison of a firm’s ratios
within its particular industry can be essential in determining strength/weakness.
3. How does each ratio compare with key competitors? Oftentimes competition is
more intense between several competitors in a given industry or location than across
all rival firms in the industry. When this is true, financial ratio analysis should
include comparison to those key competitors. For example, if a firm’s profitability
ratio is trending up over time and compares favorably to the industry average, but it
is trending down relative to its leading competitor, there may be reason for concern.
Financial ratio analysis is not without some limitations. First of all, financial ratios are
based on accounting data, and firms differ in their treatment of such items as depreciation,
inventory valuation, research and development expenditures, pension plan costs, mergers,
and taxes. Also, seasonal factors can influence comparative ratios. Therefore, conformity to
industry composite ratios does not establish with certainty that a firm is performing normally
or that it is well managed. Likewise, departures from industry averages do not always indi-
cate that a firm is doing especially well or badly. For example, a high inventory turnover ratio
could indicate efficient inventory management and a strong working capital position, but it
also could indicate a serious inventory shortage and a weak working capital position.