
Page 146 -
P. 146
112 PART 2 • STRATEGY FORMULATION
FIGURE 4-4
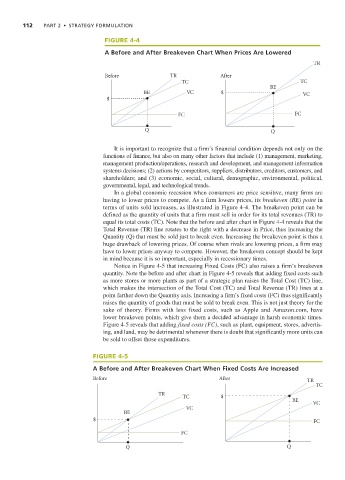
A Before and After Breakeven Chart When Prices Are Lowered
TR
Before TR After
TC TC
BE
BE VC $ VC
$
FC FC
Q Q
It is important to recognize that a firm’s financial condition depends not only on the
functions of finance, but also on many other factors that include (1) management, marketing,
management production/operations, research and development, and management information
systems decisions; (2) actions by competitors, suppliers, distributors, creditors, customers, and
shareholders; and (3) economic, social, cultural, demographic, environmental, political,
governmental, legal, and technological trends.
In a global economic recession when consumers are price sensitive, many firms are
having to lower prices to compete. As a firm lowers prices, its breakeven (BE) point in
terms of units sold increases, as illustrated in Figure 4-4. The breakeven point can be
defined as the quantity of units that a firm must sell in order for its total revenues (TR) to
equal its total costs (TC). Note that the before and after chart in Figure 4-4 reveals that the
Total Revenue (TR) line rotates to the right with a decrease in Price, thus increasing the
Quantity (Q) that must be sold just to break even. Increasing the breakeven point is thus a
huge drawback of lowering prices. Of course when rivals are lowering prices, a firm may
have to lower prices anyway to compete. However, the breakeven concept should be kept
in mind because it is so important, especially in recessionary times.
Notice in Figure 4-5 that increasing Fixed Costs (FC) also raises a firm’s breakeven
quantity. Note the before and after chart in Figure 4-5 reveals that adding fixed costs such
as more stores or more plants as part of a strategic plan raises the Total Cost (TC) line,
which makes the intersection of the Total Cost (TC) and Total Revenue (TR) lines at a
point farther down the Quantity axis. Increasing a firm’s fixed costs (FC) thus significantly
raises the quantity of goods that must be sold to break even. This is not just theory for the
sake of theory. Firms with less fixed costs, such as Apple and Amazon.com, have
lower breakeven points, which give them a decided advantage in harsh economic times.
Figure 4-5 reveals that adding fixed costs (FC), such as plant, equipment, stores, advertis-
ing, and land, may be detrimental whenever there is doubt that significantly more units can
be sold to offset those expenditures.
FIGURE 4-5
A Before and After Breakeven Chart When Fixed Costs Are Increased
Before After
TR
TC
TR
TC $
BE
VC
VC
BE
$ FC
FC
Q Q