Page 143 -
P. 143

CHAPTER 4 • THE INTERNAL ASSESSMENT  109
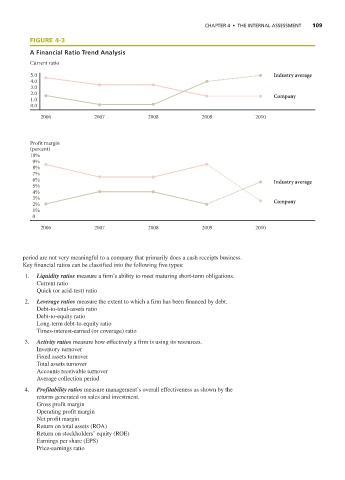
                FIGURE 4-3
                A Financial Ratio Trend Analysis
                Current ratio

                5.0                                                                             Industry average
                4.0
                3.0
                2.0                                                                             Company
                1.0
                0.0
                   2006              2007              2008             2009              2010


                Profit margin
                (percent)
                10%
                  9%
                  8%
                  7%
                  6%                                                                            Industry average
                  5%
                  4%
                  3%
                  2%                                                                            Company
                  1%
                  0
                   2006              2007              2008             2009              2010


              period are not very meaningful to a company that primarily does a cash receipts business.
              Key financial ratios can be classified into the following five types:
              1.  Liquidity ratios measure a firm’s ability to meet maturing short-term obligations.
                  Current ratio
                  Quick (or acid-test) ratio
              2.  Leverage ratios measure the extent to which a firm has been financed by debt.
                  Debt-to-total-assets ratio
                  Debt-to-equity ratio
                  Long-term debt-to-equity ratio
                  Times-interest-earned (or coverage) ratio
              3.  Activity ratios measure how effectively a firm is using its resources.
                  Inventory turnover
                  Fixed assets turnover
                  Total assets turnover
                  Accounts receivable turnover
                  Average collection period
              4.  Profitability ratios measure management’s overall effectiveness as shown by the
                  returns generated on sales and investment.
                  Gross profit margin
                  Operating profit margin
                  Net profit margin
                  Return on total assets (ROA)
                  Return on stockholders’ equity (ROE)
                  Earnings per share (EPS)
                  Price-earnings ratio
   138   139   140   141   142   143   144   145   146   147   148