
Page 420 -
P. 420
16 GREGORY STONE
place for area families to have their family night out, Tony was able to interact more fre-
quently with kids again. During his three years as business manager, he implemented
numerous small operational changes that increased corporate profitability (see Exhibit 1).
He entered into a lease agreement with a local vendor to develop the business model to
lease the gaming equipment to all the Virginia Showbiz franchises. This enabled Showbiz to
offer its owner/operators the most current games all while reducing operating and repair costs.
He also shut the restaurant down at 10 PM to families and children, and then reopened the bar
operation an hour later until 2 AM for locals to drink, dance, carouse, play pool, play video
games, and have good clean adult fun. Then Tony heard from one of his fraternity brothers that
Merryland Amusement Park was up for sale, and he knew his dream job had arrived!
The Sale of Merryland
During the unsuccessful sale attempt and subcontracted operation of Merryland, general
park maintenance was neglected. Falling revenues were also attributed to the growing
interest in nontraditional theme park attractions fueled by the cost of gasoline and increas-
ingly tight economic conditions (see Exhibit 1). Local real estate values, the lack of main-
tenance, and no new investment into the park resulted in steadily declining values from
2004 to 2008 (see Exhibit 2).
Other local patrons were more willing to make the longer drives to stay for several days
or a week to the larger “mega” theme parks such as Six Flags St. Louis as a family vacation.
Although there were no directly competing amusement parks in Kansas, the Steinbergs never
seemed to fully grasp the significance of that opportunity (see Exhibit 3). Consequently, small
niche amusement centers based in malls had begun to spring up. The bigger, more lavish
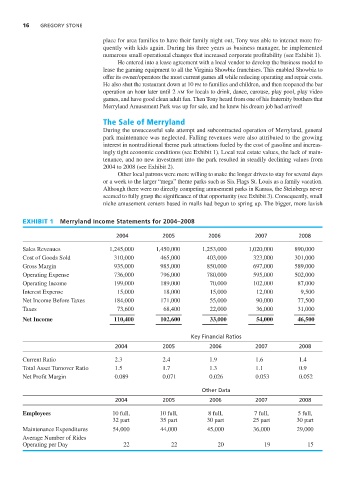
EXHIBIT 1 Merryland Income Statements for 2004–2008
2004 2005 2006 2007 2008
Sales Revenues 1,245,000 1,450,000 1,253,000 1,020,000 890,000
Cost of Goods Sold 310,000 465,000 403,000 323,000 301,000
Gross Margin 935,000 985,000 850,000 697,000 589,000
Operating Expense 736,000 796,000 780,000 595,000 502,000
Operating Income 199,000 189,000 70,000 102,000 87,000
Interest Expense 15,000 18,000 15,000 12,000 9,500
Net Income Before Taxes 184,000 171,000 55,000 90,000 77,500
Taxes 73,600 68,400 22,000 36,000 31,000
Net Income 110,400 102,600 33,000 54,000 46,500
Key Financial Ratios
2004 2005 2006 2007 2008
Current Ratio 2.3 2.4 1.9 1.6 1.4
Total Asset Turnover Ratio 1.5 1.7 1.3 1.1 0.9
Net Profit Margin 0.089 0.071 0.026 0.053 0.052
Other Data
2004 2005 2006 2007 2008
Employees 10 full, 10 full, 8 full, 7 full, 5 full,
32 part 35 part 30 part 25 part 30 part
Maintenance Expenditures 54,000 44,000 45,000 36,000 29,000
Average Number of Rides
Operating per Day 22 22 20 19 15