
Page 437 -
P. 437
CASE 3 • JETBLUE AIRWAYS CORPORATION — 2009 33
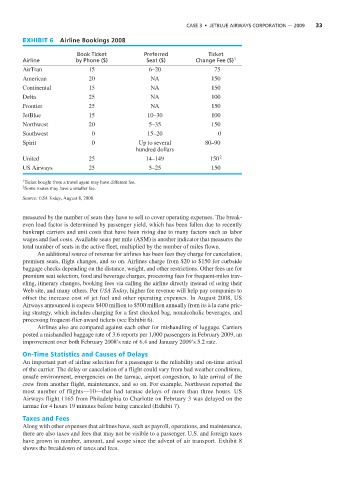
EXHIBIT 6 Airline Bookings 2008
Book Ticket Preferred Ticket
Airline by Phone ($) Seat ($) Change Fee ($) 1
AirTran 15 6–20 75
American 20 NA 150
Continental 15 NA 150
Delta 25 NA 100
Frontier 25 NA 150
JetBlue 15 10–30 100
Northwest 20 5–35 150
Southwest 0 15–20 0
Spirit 0 Up to several 80–90
hundred dollars
United 25 14–149 150 2
US Airways 25 5–25 150
1 Ticket bought from a travel agent may have different fee.
2 Some routes may have a smaller fee.
Source: USA Today, August 8, 2008.
measured by the number of seats they have to sell to cover operating expenses. The break-
even load factor is determined by passenger yield, which has been fallen due to recently
bankrupt carriers and unit costs that have been rising due to many factors such as labor
wages and fuel costs. Available seats per mile (ASM) is another indicator that measures the
total number of seats in the active fleet, multiplied by the number of miles flown.
An additional source of revenue for airlines has been fees they charge for cancelation,
premium seats, flight changes, and so on. Airlines charge from $20 to $150 for curbside
baggage checks depending on the distance, weight, and other restrictions. Other fees are for
premium seat selection, food and beverage charges, processing fees for frequent-miles trav-
eling, itinerary changes, booking fees via calling the airline directly instead of using their
Web site, and many others. Per USA Today, higher fee revenue will help pay companies to
offset the increase cost of jet fuel and other operating expenses. In August 2008, US
Airways announced it expects $400 million to $500 million annually from its à la carte pric-
ing strategy, which includes charging for a first checked bag, nonalcoholic beverages, and
processing frequent-flier-award tickets (see Exhibit 6).
Airlines also are compared against each other for mishandling of luggage. Carriers
posted a mishandled baggage rate of 3.6 reports per 1,000 passengers in February 2009, an
improvement over both February 2008’s rate of 6.4 and January 2009’s 5.2 rate.
On-Time Statistics and Causes of Delays
An important part of airline selection for a passenger is the reliability and on-time arrival
of the carrier. The delay or cancelation of a flight could vary from bad weather conditions,
unsafe environment, emergencies on the tarmac, airport congestion, to late arrival of the
crew from another flight, maintenance, and so on. For example, Northwest reported the
most number of flights—10—that had tarmac delays of more than three hours. US
Airways flight 1165 from Philadelphia to Charlotte on February 3 was delayed on the
tarmac for 4 hours 19 minutes before being canceled (Exhibit 7).
Taxes and Fees
Along with other expenses that airlines have, such as payroll, operations, and maintenance,
there are also taxes and fees that may not be visible to a passenger. U.S. and foreign taxes
have grown in number, amount, and scope since the advent of air transport. Exhibit 8
shows the breakdown of taxes and fees.