
Page 436 -
P. 436
32 MERNOUSH BANTON
expenses rose 8.1 percent. At U.S. passenger airlines, a 2.7 percent increase in average
salary and wage was more than offset by an 11.9 percent reduction in average benefits and
pension expenses and a 3.4 percent reduction in payroll taxes, pulling the average cost of a
full-time equivalent (FTE) employee down 0.9 percent to $74,786. Salaries and wages com-
posed 75 percent of total compensation.
A major problem that airlines face is union labor contracts. Typically, labor contract
negotiations in the airline industry take as long as 1.3 years. Once negotiation is finalized, then
it goes through several months of federal mediation. In most cases, the duration of negotiation
is to be attributed to which airline and unions are bargaining and not necessarily to the eco-
nomic conditions. Unions such as the International Association of Machinists and the Aircraft
Mechanics Fraternal Association worked hard to negotiate contracts on behalf of ramp workers
and customer-service agents with United Airlines in order to avoid a U.S. bankruptcy ruling.
Such a ruling could void the current labor contracts and allow United Airlines to impose new
terms. The pitfall is that such unions can plan to strike if no agreements are reached.
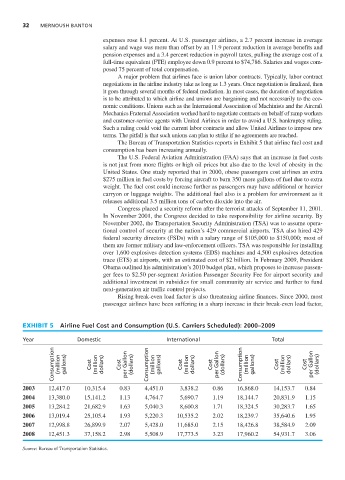
The Bureau of Transportation Statistics reports in Exhibit 5 that airline fuel cost and
consumption has been increasing annually.
The U.S. Federal Aviation Administration (FAA) says that an increase in fuel costs
is not just from more flights or high oil prices but also due to the level of obesity in the
United States. One study reported that in 2000, obese passengers cost airlines an extra
$275 million in fuel costs by forcing aircraft to burn 350 more gallons of fuel due to extra
weight. The fuel cost could increase further as passengers may have additional or heavier
carryon or luggage weights. The additional fuel also is a problem for environment as it
releases additional 3.5 million tons of carbon dioxide into the air.
Congress placed a security reform after the terrorist attacks of September 11, 2001.
In November 2001, the Congress decided to take responsibility for airline security. By
November 2002, the Transportation Security Administration (TSA) was to assume opera-
tional control of security at the nation’s 429 commercial airports. TSA also hired 429
federal security directors (FSDs) with a salary range of $105,000 to $150,000; most of
them are former military and law-enforcement officers. TSA was responsible for installing
over 1,600 explosives detection systems (EDS) machines and 4,500 explosives detection
trace (ETS) at airports, with an estimated cost of $2 billion. In February 2009, President
Obama outlined his administration’s 2010 budget plan, which proposes to increase passen-
ger fees to $2.50 per-segment Aviation Passenger Security Fee for airport security and
additional investment in subsidies for small community air service and further to fund
next-generation air traffic control projects.
Rising break-even load factor is also threatening airline finances. Since 2000, most
passenger airlines have been suffering in a sharp increase in their break-even load factor,
EXHIBIT 5 Airline Fuel Cost and Consumption (U.S. Carriers Scheduled): 2000–2009
Year Domestic International Total
Consumption (million gallons) Cost (million dollars) Cost Gallon per (dollars) Consumption (million gallons) Cost (million dollars) Cost Gallon per (dollars) Consumption (million gallons) Cost (million dollars) Cost Gallon per (dollars)
2003 12,417.0 10,315.4 0.83 4,451.0 3,838.2 0.86 16,868.0 14,153.7 0.84
2004 13,380.0 15,141.2 1.13 4,764.7 5,690.7 1.19 18,144.7 20,831.9 1.15
2005 13,284.2 21,682.9 1.63 5,040.3 8,600.8 1.71 18,324.5 30,283.7 1.65
2006 13,019.4 25,105.4 1.93 5,220.3 10,535.2 2.02 18,239.7 35,640.6 1.95
2007 12,998.8 26,899.9 2.07 5,428.0 11,685.0 2.15 18,426.8 38,584.9 2.09
2008 12,451.3 37,158.2 2.98 5,508.9 17,773.5 3.23 17,960.2 54,931.7 3.06
Source: Bureau of Transportation Statistics.