
Page 435 -
P. 435
CASE 3 • JETBLUE AIRWAYS CORPORATION — 2009 31
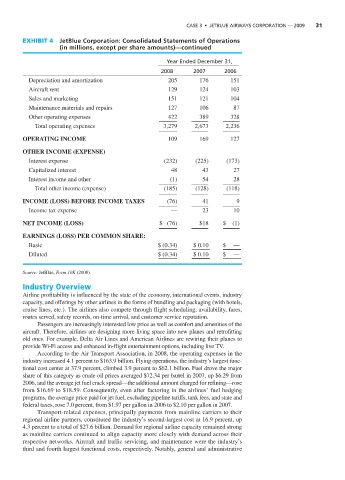
EXHIBIT 4 JetBlue Corporation: Consolidated Statements of Operations
(in millions, except per share amounts)—continued
Year Ended December 31,
2008 2007 2006
Depreciation and amortization 205 176 151
Aircraft rent 129 124 103
Sales and marketing 151 121 104
Maintenance materials and repairs 127 106 87
Other operating expenses 422 389 328
Total operating expenses 3,279 2,673 2,236
OPERATING INCOME 109 169 127
OTHER INCOME (EXPENSE)
Interest expense (232) (225) (173)
Capitalized interest 48 43 27
Interest income and other (1) 54 28
Total other income (expense) (185) (128) (118)
INCOME (LOSS) BEFORE INCOME TAXES (76) 41 9
Income tax expense — 23 10
NET INCOME (LOSS) $ (76) $18 $ (1)
EARNINGS (LOSS) PER COMMON SHARE:
Basic $ (0.34) $ 0.10 $ —
Diluted $ (0.34) $ 0.10 $ —
Source: JetBlue, Form 10K (2008).
Industry Overview
Airline profitability is influenced by the state of the economy, international events, industry
capacity, and offerings by other airlines in the forms of bundling and packaging (with hotels,
cruise lines, etc.). The airlines also compete through flight scheduling, availability, fares,
routes served, safety records, on-time arrival, and customer service reputation.
Passengers are increasingly interested low price as well as comfort and amenities of the
aircraft. Therefore, airlines are designing more living space into new planes and retrofitting
old ones. For example, Delta Air Lines and American Airlines are rewiring their planes to
provide Wi-Fi access and enhanced in-flight entertainment options, including live TV.
According to the Air Transport Association, in 2008, the operating expenses in the
industry increased 4.1 percent to $163.9 billion. Flying operations, the industry’s largest func-
tional cost center at 37.9 percent, climbed 3.9 percent to $62.1 billion. Fuel drove the major
share of this category as crude oil prices averaged $72.34 per barrel in 2007, up $6.29 from
2006, and the average jet fuel crack spread—the additional amount charged for refining—rose
from $16.69 to $18.59. Consequently, even after factoring in the airlines’ fuel hedging
programs, the average price paid for jet fuel, excluding pipeline tariffs, tank fees, and state and
federal taxes, rose 7.0 percent, from $1.97 per gallon in 2006 to $2.10 per gallon in 2007.
Transport-related expenses, principally payments from mainline carriers to their
regional airline partners, constituted the industry’s second-largest cost at 16.9 percent, up
4.3 percent to a total of $27.6 billion. Demand for regional airline capacity remained strong
as mainline carriers continued to align capacity more closely with demand across their
respective networks. Aircraft and traffic servicing, and maintenance were the industry’s
third and fourth largest functional costs, respectively. Notably, general and administrative