
Page 483 -
P. 483
CASE 7 • WHOLE FOODS MARKET, INC. — 2009 79
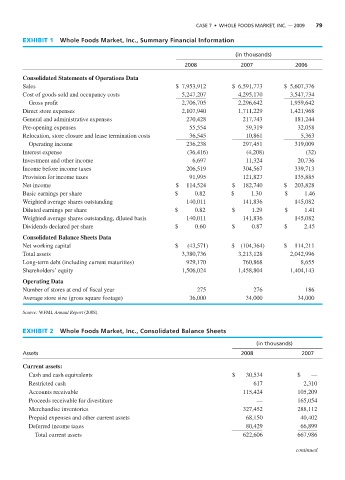
EXHIBIT 1 Whole Foods Market, Inc., Summary Financial Information
(in thousands)
2008 2007 2006
Consolidated Statements of Operations Data
Sales $ 7,953,912 $ 6,591,773 $ 5,607,376
Cost of goods sold and occupancy costs 5,247,207 4,295,170 3,547,734
Gross profit 2,706,705 2,296,642 1,959,642
Direct store expenses 2,107,940 1,711,229 1,421,968
General and administrative expenses 270,428 217,743 181,244
Pre-opening expenses 55,554 59,319 32,058
Relocation, store closure and lease termination costs 36,545 10,861 5,363
Operating income 236,238 297,451 319,009
Interest expense (36,416) (4,208) (32)
Investment and other income 6,697 11,324 20,736
Income before income taxes 206,519 304,567 339,713
Provision for income taxes 91,995 121,827 135,885
Net income $ 114,524 $ 182,740 $ 203,828
Basic earnings per share $ 0.82 $ 1.30 $ 1.46
Weighted average shares outstanding 140,011 141,836 145,082
Diluted earnings per share $ 0.82 $ 1.29 $ 1.41
Weighted average shares outstanding, diluted basis 140,011 141,836 145,082
Dividends declared per share $ 0.60 $ 0.87 $ 2.45
Consolidated Balance Sheets Data
Net working capital $ (43,571) $ (104,364) $ 114,211
Total assets 3,380,736 3,213,128 2,042,996
Long-term debt (including current maturities) 929,170 760,868 8,655
Shareholders’ equity 1,506,024 1,458,804 1,404,143
Operating Data
Number of stores at end of fiscal year 275 276 186
Average store size (gross square footage) 36,000 34,000 34,000
Source: WFMI, Annual Report (2008).
EXHIBIT 2 Whole Foods Market, Inc., Consolidated Balance Sheets
(in thousands)
Assets 2008 2007
Current assets:
Cash and cash equivalents $ 30,534 $ —
Restricted cash 617 2,310
Accounts receivable 115,424 105,209
Proceeds receivable for divestiture — 165,054
Merchandise inventories 327,452 288,112
Prepaid expenses and other current assets 68,150 40,402
Deferred income taxes 80,429 66,899
Total current assets 622,606 667,986
continued