
Page 484 -
P. 484
80 JAMES L. HARBIN AND PATRICIA HUMPHREY
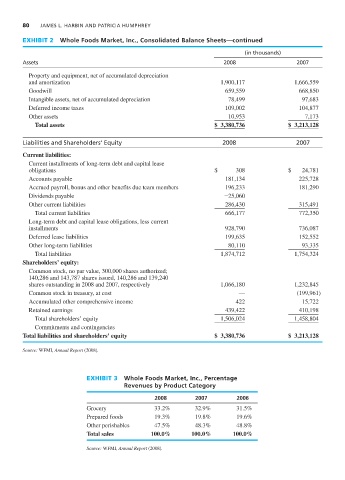
EXHIBIT 2 Whole Foods Market, Inc., Consolidated Balance Sheets—continued
(in thousands)
Assets 2008 2007
Property and equipment, net of accumulated depreciation
and amortization 1,900,117 1,666,559
Goodwill 659,559 668,850
Intangible assets, net of accumulated depreciation 78,499 97,683
Deferred income taxes 109,002 104,877
Other assets 10,953 7,173
Total assets $ 3,380,736 $ 3,213,128
Liabilities and Shareholders’ Equity 2008 2007
Current liabilities:
Current installments of long-term debt and capital lease
obligations $ 308 $ 24,781
Accounts payable 181,134 225,728
Accrued payroll, bonus and other benefits due team members 196,233 181,290
Dividends payable -25,060
Other current liabilities 286,430 315,491
Total current liabilities 666,177 772,350
Long-term debt and capital lease obligations, less current
installments 928,790 736,087
Deferred lease liabilities 199,635 152,552
Other long-term liabilities 80,110 93,335
Total liabilities 1,874,712 1,754,324
Shareholders’ equity:
Common stock, no par value, 300,000 shares authorized;
140,286 and 143,787 shares issued, 140,286 and 139,240
shares outstanding in 2008 and 2007, respectively 1,066,180 1,232,845
Common stock in treasury, at cost — (199,961)
Accumulated other comprehensive income 422 15,722
Retained earnings 439,422 410,198
Total shareholders’ equity 1,506,024 1,458,804
Commitments and contingencies
Total liabilities and shareholders’ equity $ 3,380,736 $ 3,213,128
Source: WFMI, Annual Report (2008).
EXHIBIT 3 Whole Foods Market, Inc., Percentage
Revenues by Product Category
2008 2007 2006
Grocery 33.2% 32.9% 31.5%
Prepared foods 19.3% 19.8% 19.6%
Other perishables 47.5% 48.3% 48.8%
Total sales 100.0% 100.0% 100.0%
Source: WFMI, Annual Report (2008).