Page 64 -
P. 64

30    PART 1 • OVERVIEW OF STRATEGIC MANAGEMENT


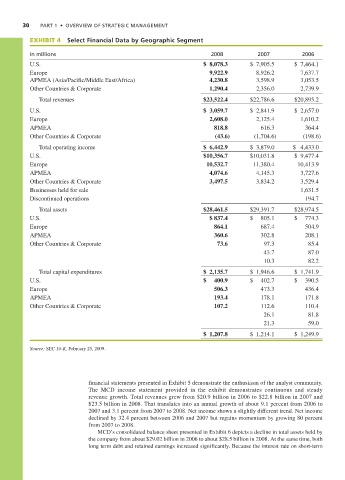
              EXHIBIT 4   Select Financial Data by Geographic Segment
              In millions                                                2008           2007           2006
              U.S.                                                    $ 8,078.3       $ 7,905.5     $ 7,464.1
              Europe                                                    9,922.9         8,926.2       7,637.7
              APMEA (Asia/Pacific/Middle East/Africa)                   4,230.8         3,598.9       3,053.5
              Other Countries & Corporate                               1,290.4         2,356.0       2,739.9

                 Total revenues                                       $23,522.4       $22,786.6     $20,895.2
              U.S.                                                    $ 3,059.7       $ 2,841.9     $ 2,657.0
              Europe                                                    2,608.0         2,125.4       1,610.2
              APMEA                                                       818.8          616.3          364.4
              Other Countries & Corporate                                 (43.6)       (1,704.6)       (198.6)
                 Total operating income                               $ 6,442.9       $ 3,879.0     $ 4,433.0
              U.S.                                                    $10,356.7       $10,031.8     $ 9,477.4
              Europe                                                   10,532.7        11,380.4      10,413.9
              APMEA                                                     4,074.6         4,145.3       3,727.6
              Other Countries & Corporate                               3,497.5         3,834.2       3,529.4
              Businesses held for sale                                                                1,631.5
              Discontinued operations                                                                   194.7
                 Total assets                                         $28,461.5       $29,391.7     $28,974.5
              U.S.                                                      $ 837.4       $  805.1      $   774.3
              Europe                                                      864.1          687.4          504.9
              APMEA                                                       360.6          302.8          208.1
              Other Countries & Corporate                                  73.6           97.3           85.4
                                                                                          43.7           87.0
                                                                                          10.3           82.2
                 Total capital expenditures                           $ 2,135.7       $ 1,946.6     $ 1,741.9
              U.S.                                                    $   400.9       $  402.7      $   390.5
              Europe                                                      506.3          473.3          436.4
              APMEA                                                       193.4          178.1          171.8
              Other Countries & Corporate                                 107.2          112.6          110.4
                                                                                          26.1           81.8
                                                                                          21.3           59.0

                                                                      $ 1,207.8       $ 1,214.1     $ 1,249.9

              Source: SEC 10-K, February 25, 2009.


                                 financial statements presented in Exhibit 5 demonstrate the enthusiasm of the analyst community.
                                 The MCD income statement provided in the exhibit demonstrates continuous and steady
                                 revenue growth. Total revenues grew from $20.9 billion in 2006 to $22.8 billion in 2007 and
                                 $23.5 billion in 2008. That translates into an annual growth of about 9.1 percent from 2006 to
                                 2007 and 3.1 percent from 2007 to 2008. Net income shows a slightly different trend. Net income
                                 declined by 32.4 percent between 2006 and 2007 but regains momentum by growing 80 percent
                                 from 2007 to 2008.
                                    MCD’s consolidated balance sheet presented in Exhibit 6 depicts a decline in total assets held by
                                 the company from about $29.02 billion in 2006 to about $28.5 billion in 2008. At the same time, both
                                 long term debt and retained earnings increased significantly. Because the interest rate on short-term
   59   60   61   62   63   64   65   66   67   68   69