
Page 176 - Sustainability in the Process Industry Integration and Optimization
P. 176
Pro c ess O p timization F r ame w ork s 153
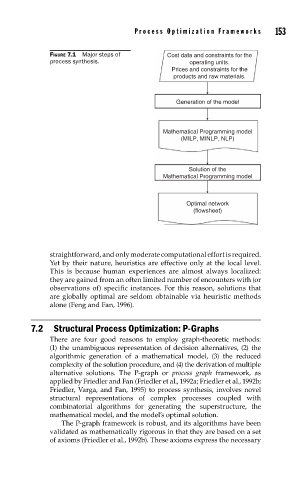
FIGURE 7.1 Major steps of Cost data and constraints for the
process synthesis. operating units.
Prices and constraints for the
products and raw materials.
Generation of the model
Mathematical Programming model
(MILP, MINLP, NLP)
Solution of the
Mathematical Programming model
Optimal network
(flowsheet)
straightforward, and only moderate computational effort is required.
Yet by their nature, heuristics are effective only at the local level.
This is because human experiences are almost always localized:
they are gained from an often limited number of encounters with (or
observations of) specific instances. For this reason, solutions that
are globally optimal are seldom obtainable via heuristic methods
alone (Feng and Fan, 1996).
7.2 Structural Process Optimization: P-Graphs
There are four good reasons to employ graph-theoretic methods:
(1) the unambiguous representation of decision alternatives, (2) the
algorithmic generation of a mathematical model, (3) the reduced
complexity of the solution procedure, and (4) the derivation of multiple
alternative solutions. The P-graph or process graph framework, as
applied by Friedler and Fan (Friedler et al., 1992a; Friedler et al., 1992b;
Friedler, Varga, and Fan, 1995) to process synthesis, involves novel
structural representations of complex processes coupled with
combinatorial algorithms for generating the superstructure, the
mathematical model, and the model’s optimal solution.
The P-graph framework is robust, and its algorithms have been
validated as mathematically rigorous in that they are based on a set
of axioms (Friedler et al., 1992b). These axioms express the necessary