
Page 172 - Sustainability in the Process Industry Integration and Optimization
P. 172
Fu r t h e r A p p l i c a t i o n s o f P r o c e s s I n t e g r a t i o n 149
that is unable to meet its demands locally. The grid system can
distribute power (electricity) and heating in the form of hot water or
steam. In geographic locations where air conditioning is required, a
cooling distribution main could also be provided. If local sources
are unable to provide for the demands of all units in the system,
then district renewable sources can be provided. These would
include larger-scale wind turbines, solar-cell systems, heat pumps,
and combustors fed by waste from the units or by biofuels or fossil
fuels. The sources at this level would include power-generating
equipment such as turbines driven by steam or gas.
Varbanov and Klemeš (2010) presented a further extension of the
Total Sites methodology that covers industrial, residential, service,
business, and agricultural customers; incorporates renewable energy
sources; and accounts for variability on both the supply and demand
sides. The challenge of increasing the share of renewables in the
energy mix can be met by integrating solar, wind, biomass, and
geothermal energy as well as by integrating some types of waste
with the fossil fuels. The availability of renewables and the energy
demands of the considered sites all vary significantly with the time
of day, period of the year, and location. Some of these factors are
unpredictable and can change quickly. Total Site Combined Heat and
Power energy systems are optimized by minimizing heat waste and
carbon footprint while maximizing economic viability. This
methodology incorporates state-of-the-art techniques of Total Site
Integration (Klemeš et al., 1997), batch Heat Integration (Kemp and
Deakin, 1989), HEN sensitivity analysis (Kotjabasakis and Linnhoff,
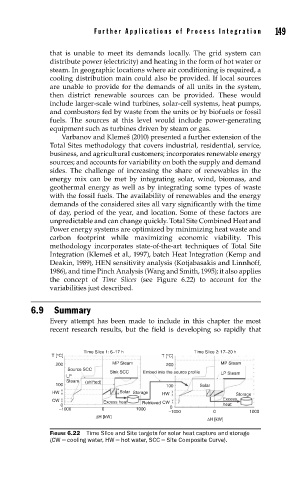
1986), and time Pinch Analysis (Wang and Smith, 1995); it also applies
the concept of Time Slices (see Figure 6.22) to account for the
variabilities just described.
6.9 Summary
Every attempt has been made to include in this chapter the most
recent research results, but the field is developing so rapidly that
Time Slice 1: 6–17 h Time Slice 2: 17–20 h
T [°C] T [°C]
200 MP Steam 200 MP Steam
Source SCC
Sink SCC Embed into the source profile LP Steam
LP
Steam (shifted)
100 100 Solar
HW Solar Storage HW Storage
CW Excess heat Retrieved CW Excess
0 0 heat
−1000 0 1000
−1000 0 1000
ΔH [kW]
ΔH [kW]
FIGURE 6.22 Time Slice and Site targets for solar heat capture and storage
(CW = cooling water, HW = hot water, SCC = Site Composite Curve).