
Page 183 - Sustainability in the Process Industry Integration and Optimization
P. 183
160 Cha p te r S e v e n
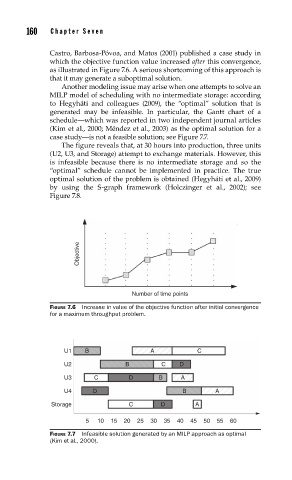
Castro, Barbosa-Póvoa, and Matos (2001) published a case study in
which the objective function value increased after this convergence,
as illustrated in Figure 7.6. A serious shortcoming of this approach is
that it may generate a suboptimal solution.
Another modeling issue may arise when one attempts to solve an
MILP model of scheduling with no intermediate storage: according
to Hegyháti and colleagues (2009), the “optimal” solution that is
generated may be infeasible. In particular, the Gantt chart of a
schedule—which was reported in two independent journal articles
(Kim et al., 2000; Méndez et al., 2003) as the optimal solution for a
case study—is not a feasible solution; see Figure 7.7.
The figure reveals that, at 30 hours into production, three units
(U2, U3, and Storage) attempt to exchange materials. However, this
is infeasible because there is no intermediate storage and so the
“optimal” schedule cannot be implemented in practice. The true
optimal solution of the problem is obtained (Hegyháti et al., 2009)
by using the S-graph framework (Holczinger et al., 2002); see
Figure 7.8.
Objective
Number of time points
FIGURE 7.6 Increase in value of the objective function after initial convergence
for a maximum throughput problem.
U1 B A C
U2 B C D
U3 C D B A
U4 D B A
Storage C D A
5 10 15 20 25 30 35 40 45 50 55 60
FIGURE 7.7 Infeasible solution generated by an MILP approach as optimal
(Kim et al., 2000).