
Page 184 - Sustainability in the Process Industry Integration and Optimization
P. 184
Pro c ess O p timization F r ame w ork s 161
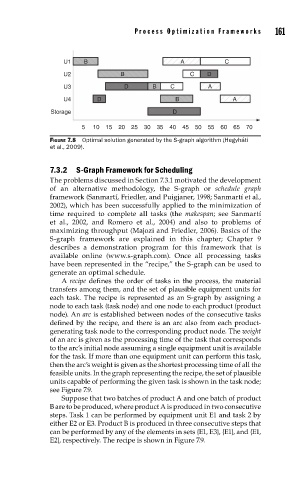
U1 B A C
U2 B C D
U3 D B C A
U4 D B A
Storage D
5 10 15 20 25 30 35 40 45 50 55 60 65 70
FIGURE 7.8 Optimal solution generated by the S-graph algorithm (Hegyháti
et al., 2009).
7.3.2 S-Graph Framework for Scheduling
The problems discussed in Section 7.3.1 motivated the development
of an alternative methodology, the S-graph or schedule graph
framework (Sanmartí, Friedler, and Puigjaner, 1998; Sanmartí et al.,
2002), which has been successfully applied to the minimization of
time required to complete all tasks (the makespan; see Sanmartí
et al., 2002, and Romero et al., 2004) and also to problems of
maximizing throughput (Majozi and Friedler, 2006). Basics of the
S-graph framework are explained in this chapter; Chapter 9
describes a demonstration program for this framework that is
available online (www.s-graph.com). Once all processing tasks
have been represented in the “recipe,” the S-graph can be used to
generate an optimal schedule.
A recipe defines the order of tasks in the process, the material
transfers among them, and the set of plausible equipment units for
each task. The recipe is represented as an S-graph by assigning a
node to each task (task node) and one node to each product (product
node). An arc is established between nodes of the consecutive tasks
defined by the recipe, and there is an arc also from each product-
generating task node to the corresponding product node. The weight
of an arc is given as the processing time of the task that corresponds
to the arc’s initial node assuming a single equipment unit is available
for the task. If more than one equipment unit can perform this task,
then the arc’s weight is given as the shortest processing time of all the
feasible units. In the graph representing the recipe, the set of plausible
units capable of performing the given task is shown in the task node;
see Figure 7.9.
Suppose that two batches of product A and one batch of product
B are to be produced, where product A is produced in two consecutive
steps. Task 1 can be performed by equipment unit E1 and task 2 by
either E2 or E3. Product B is produced in three consecutive steps that
can be performed by any of the elements in sets {E1, E3}, {E1}, and {E1,
E2}, respectively. The recipe is shown in Figure 7.9.