
Page 313 - Sustainability in the Process Industry Integration and Optimization
P. 313
290 Cha p te r T w e l v e
T
160°
80°
45°
150° 10°
160°
ΔH
ΔH 3 ΔH ΔH 2 ΔH 3
1
190°
120° 40°
Reactor
80° 45° 45° 10°
ΔH 2 ΔH 1 Feed
140° Unit 140°
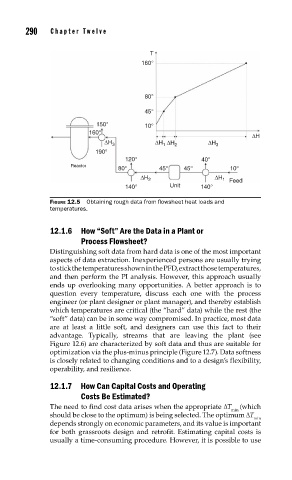
FIGURE 12.5 Obtaining rough data from fl owsheet heat loads and
temperatures.
12.1.6 How “Soft” Are the Data in a Plant or
Process Flowsheet?
Distinguishing soft data from hard data is one of the most important
aspects of data extraction. Inexperienced persons are usually trying
to stick the temperatures shown in the PFD, extract those temperatures,
and then perform the PI analysis. However, this approach usually
ends up overlooking many opportunities. A better approach is to
question every temperature, discuss each one with the process
engineer (or plant designer or plant manager), and thereby establish
which temperatures are critical (the “hard” data) while the rest (the
“soft” data) can be in some way compromised. In practice, most data
are at least a little soft, and designers can use this fact to their
advantage. Typically, streams that are leaving the plant (see
Figure 12.6) are characterized by soft data and thus are suitable for
optimization via the plus-minus principle (Figure 12.7). Data softness
is closely related to changing conditions and to a design’s flexibility,
operability, and resilience.
12.1.7 How Can Capital Costs and Operating
Costs Be Estimated?
The need to find cost data arises when the appropriate ΔT (which
min
should be close to the optimum) is being selected. The optimum ΔT
min
depends strongly on economic parameters, and its value is important
for both grassroots design and retrofit. Estimating capital costs is
usually a time-consuming procedure. However, it is possible to use