
Page 346 - Sustainable Cities and Communities Design Handbook
P. 346
Urban Sustainability and Industrial Migration Chapter j 16 319
time, as brought the State Council decision for Hefei to expand its jurisdiction
to incorporate nearby Lujiang County and its 2 million people.
In the 2011 and 2013 Urban Sustainability Index for Chinese cities, Hefei
ranked among the top three most sustainable central region cities, and in the
top 10 medium GDP ($5e20 billion) cities showing sustainability improve-
ments from 2008 to 2011 (McKinsey, 2012, 2014). In the 2011 and 2012
Green Development Index reports, among nearly 40 Chinese cities, Hefei
scored a middle-level rank overall, but was in the top two for the central region
(Li and Pan, 2011, 2012). These indices demonstrate that Hefei’s environ-
mental protection performance following its “green transition” has been
assessed as highdfor the central regiondby measures other than those used in
this study. Observing the city of Changsha offers additional valuable insights.
In all of the above-mentioned Urban Sustainability Index and Green Devel-
opment Index reports, Changsha was the one central region city outranking
Hefei, which is reflective of both Changsha’s post-2010 drop in industrial raw
coal consumption (Fig. 16.4) and drop in industrial SO 2 emissions, the
sharpest among the central capital cities (Fig. 16.5).
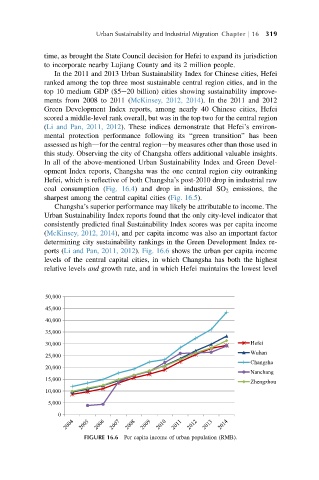
Changsha’s superior performance may likely be attributable to income. The
Urban Sustainability Index reports found that the only city-level indicator that
consistently predicted final Sustainability Index scores was per capita income
(McKinsey, 2012, 2014), and per capita income was also an important factor
determining city sustainability rankings in the Green Development Index re-
ports (Li and Pan, 2011, 2012). Fig. 16.6 shows the urban per capita income
levels of the central capital cities, in which Changsha has both the highest
relative levels and growth rate, and in which Hefei maintains the lowest level
50,000
45,000
40,000
35,000
30,000 Hefei
Wuhan
25,000
Changsha
20,000
Nanchang
15,000
Zhengzhou
10,000
5,000
0
FIGURE 16.6 Per capita income of urban population (RMB).