
Page 573 - Sustainable Cities and Communities Design Handbook
P. 573
542 Sustainable Cities and Communities Design Handbook
TABLE 27.2 Summary of Total and Available Area for Installation of RES
2
2
Location Total Space (m ) Available Space for Solar (m )
Rooftop 42,680 13,376
Carports
Walkways
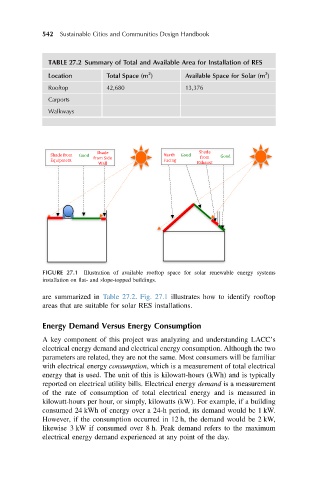
FIGURE 27.1 Illustration of available rooftop space for solar renewable energy systems
installation on flat- and slope-topped buildings.
are summarized in Table 27.2. Fig. 27.1 illustrates how to identify rooftop
areas that are suitable for solar RES installations.
Energy Demand Versus Energy Consumption
A key component of this project was analyzing and understanding LACC’s
electrical energy demand and electrical energy consumption. Although the two
parameters are related, they are not the same. Most consumers will be familiar
with electrical energy consumption, which is a measurement of total electrical
energy that is used. The unit of this is kilowatt-hours (kWh) and is typically
reported on electrical utility bills. Electrical energy demand is a measurement
of the rate of consumption of total electrical energy and is measured in
kilowatt-hours per hour, or simply, kilowatts (kW). For example, if a building
consumed 24 kWh of energy over a 24-h period, its demand would be 1 kW.
However, if the consumption occurred in 12 h, the demand would be 2 kW,
likewise 3 kW if consumed over 8 h. Peak demand refers to the maximum
electrical energy demand experienced at any point of the day.