
Page 581 - Sustainable Cities and Communities Design Handbook
P. 581
The Los Angeles Community College District Chapter j 27 549
the work of Graham and Hollands (1990). The algorithm produces synthetic solar
data with certain statistical properties that result in a data sequence that has
realistic day-to-day and hour-to-hour variability and autocorrelation.
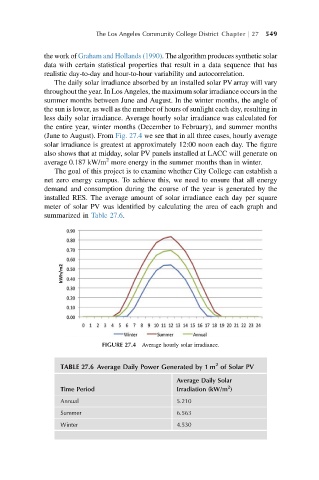
The daily solar irradiance absorbed by an installed solar PV array will vary
throughout the year. In Los Angeles, the maximum solar irradiance occurs in the
summer months between June and August. In the winter months, the angle of
the sun is lower, as well as the number of hours of sunlight each day, resulting in
less daily solar irradiance. Average hourly solar irradiance was calculated for
the entire year, winter months (December to February), and summer months
(June to August). From Fig. 27.4 we see that in all three cases, hourly average
solar irradiance is greatest at approximately 12:00 noon each day. The figure
also shows that at midday, solar PV panels installed at LACC will generate on
2
average 0.187 kW/m more energy in the summer months than in winter.
The goal of this project is to examine whether City College can establish a
net zero energy campus. To achieve this, we need to ensure that all energy
demand and consumption during the course of the year is generated by the
installed RES. The average amount of solar irradiance each day per square
meter of solar PV was identified by calculating the area of each graph and
summarized in Table 27.6.
FIGURE 27.4 Average hourly solar irradiance.
2
TABLE 27.6 Average Daily Power Generated by 1 m of Solar PV
Average Daily Solar
2
Time Period Irradiation (kW/m )
Annual 5.210
Summer 6.563
Winter 4.530