
Page 103 - Sustainable On-Site CHP Systems Design, Construction, and Operations
P. 103
Thermal Design for CHP 81
25,000
20,000
Peak hourly load (tons) 15,000
10,000
5,000
0
0 1000 2000 3000 4000 5000 6000 7000 8000
Hours per year
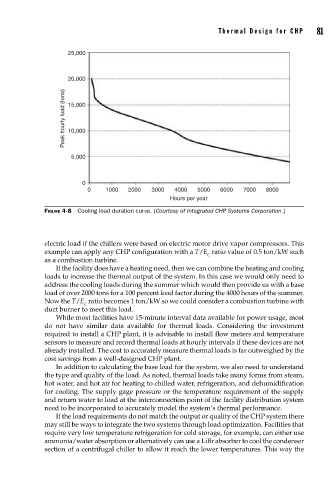
FIGURE 4-8 Cooling load duration curve. (Courtesy of Integrated CHP Systems Corporation.)
electric load if the chillers were based on electric motor drive vapor compressors. This
example can apply any CHP configuration with a T/E ratio value of 0.5 ton/kW such
C
as a combustion turbine.
If the facility does have a heating need, then we can combine the heating and cooling
loads to increase the thermal output of the system. In this case we would only need to
address the cooling loads during the summer which would then provide us with a base
load of over 2000 tons for a 100 percent load factor during the 4000 hours of the summer.
Now the T/E ratio becomes 1 ton/kW so we could consider a combustion turbine with
C
duct burner to meet this load.
While most facilities have 15-minute interval data available for power usage, most
do not have similar data available for thermal loads. Considering the investment
required to install a CHP plant, it is advisable to install flow meters and temperature
sensors to measure and record thermal loads at hourly intervals if these devices are not
already installed. The cost to accurately measure thermal loads is far outweighed by the
cost savings from a well-designed CHP plant.
In addition to calculating the base load for the system, we also need to understand
the type and quality of the load. As noted, thermal loads take many forms from steam,
hot water, and hot air for heating to chilled water, refrigeration, and dehumidification
for cooling. The supply gage pressure or the temperature requirement of the supply
and return water to load at the interconnection point of the facility distribution system
need to be incorporated to accurately model the system’s thermal performance.
If the load requirements do not match the output or quality of the CHP system there
may still be ways to integrate the two systems through load optimization. Facilities that
require very low temperature refrigeration for cold storage, for example, can either use
ammonia/water absorption or alternatively can use a LiBr absorber to cool the condenser
section of a centrifugal chiller to allow it reach the lower temperatures. This way the