
Page 150 - Sustainable On-Site CHP Systems Design, Construction, and Operations
P. 150
Carbon Footprint—Envir onmental Benefits and Emission Contr ols 123
Emission Control Combustion Turbine Capacity (MW)
Technology 5 Continuous 25 Continuous 100 Continuous 25 Peaking 100 Peaking
Water Injection
Installed cost ($) 544,000 1,140,000 2,560,000 1,140,000 2,560,000
Annual operating 165,000 408,000 1,180,000 248,000 624,000
cost ($)
Cost-effectiveness 1,390–1,780 690–880 500–640 1,670–2,150 1,050–1,350
($/ton)
Steam Injection
Installed cost ($) 710,000 1,161,000 3,900,000 1,610,000 3,900,000
Annual operating 185,000 448,000 1,250,000 319,000 813,000
cost ($)
Cost-effectiveness 1,560–2,000 760–970 520–670 2,150–2,760 1,370–1,760
($/ton)
DLN
Installed cost ($) 482,000 1,100,000 2,400,000 1,100,000 2,400,000
Annual operating 63,400 145,000 316,000 258,000 316,000
cost ($)
Cost-effectiveness 530–800 240–370 130–200 980–1,470 530–800
($/ton)
SCR
Installed cost ($) 572,000 1,540,000 3,300,000 1,540,000 3,300,000
Annual operating 258,000 732,000 2,190,000 517,000 1,430,000
cost ($)
Cost-effectiveness 2,180–2,450 1,230–1,390 920–1,030 3,480–3,920 2,400–2,700
($/ton)
Source: Combined Heating, Cooling, and Power Handbook (2002).
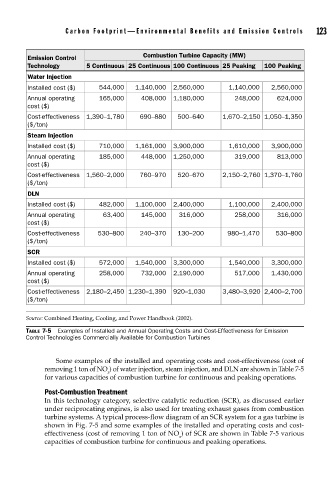
TABLE 7-5 Examples of Installed and Annual Operating Costs and Cost-Effectiveness for Emission
Control Technologies Commercially Available for Combustion Turbines
Some examples of the installed and operating costs and cost-effectiveness (cost of
removing 1 ton of NO ) of water injection, steam injection, and DLN are shown in Table 7-5
x
for various capacities of combustion turbine for continuous and peaking operations.
Post-Combustion Treatment
In this technology category, selective catalytic reduction (SCR), as discussed earlier
under reciprocating engines, is also used for treating exhaust gases from combustion
turbine systems. A typical process-flow diagram of an SCR system for a gas turbine is
shown in Fig. 7-5 and some examples of the installed and operating costs and cost-
effectiveness (cost of removing 1 ton of NO ) of SCR are shown in Table 7-5 various
x
capacities of combustion turbine for continuous and peaking operations.