
Page 170 - Sustainable On-Site CHP Systems Design, Construction, and Operations
P. 170
CHP Economic Analysis 143
Life-Cycle-Cost Process
The typical life-cycle-cost (LCC) process involves estimating the annual costs (cash
flow) that result from each of the alternatives under consideration, counting for factors
such as escalation (inflation) and the cost of financing, and comparing the resultant net
present values (NPV), which is discussed later in the chapter. The alternative with the
lowest NPV will be the best alternative in economic terms (best investment of capital).
If long-term cost savings, as represented by a positive NPV of annual savings, is
obtained with a fixed interest rate and realistic selection of economic factors, including
escalation, that the alternative is considered to be economically viable.
Capital Costs versus Annual Costs
Capital costs are those associated with constructing the CHP system including: plant
building(s), the purchase and installation of all necessary equipment, controls, instru-
mentation, piping, and appurtenances needed for operation. Typically, capital costs are
the first costs of an alternative. Capital costs can occur further into the project replacing
existing equipment that is at the end of its service life or replacing equipment with a
service life less than that of the entire project. The determinant of how these costs are
considered will be whether money for less than annual replacement of equipment is
budgeted annually and saved for the year when the replacement occurs, or if capital is
obtained at the time of the replacement.
Annual costs are those that are regularly occurring, typically on an annual basis.
Examples of annual costs are fuel purchases, electricity purchases from the utility, labor
costs for operators, cost of consumables, and periodic maintenance and repair costs.
As mentioned above, some maintenance items, repairs, or replacements happen at a
frequency of more than 1 year. In this case, the annual cost calculation may “annualize”
those costs. For example, if the project life is 20 years, but every 5 years, the engine
needs to be rebuilt, one-fifth of the rebuild cost is budgeted and set aside every year.
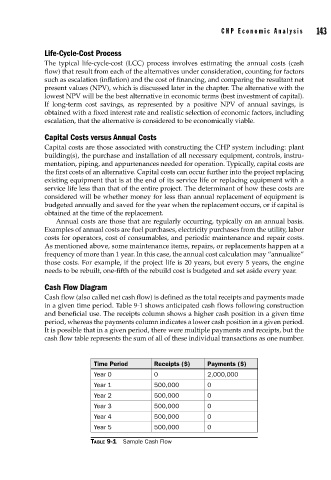
Cash Flow Diagram
Cash flow (also called net cash flow) is defined as the total receipts and payments made
in a given time period. Table 9-1 shows anticipated cash flows following construction
and beneficial use. The receipts column shows a higher cash position in a given time
period, whereas the payments column indicates a lower cash position in a given period.
It is possible that in a given period, there were multiple payments and receipts, but the
cash flow table represents the sum of all of these individual transactions as one number.
Time Period Receipts ($) Payments ($)
Year 0 0 2,000,000
Year 1 500,000 0
Year 2 500,000 0
Year 3 500,000 0
Year 4 500,000 0
Year 5 500,000 0
TABLE 9-1 Sample Cash Flow