Page 324 - Sustainable On-Site CHP Systems Design, Construction, and Operations
P. 324

Sustaining Operational Ef ficiency of a CHP System     297


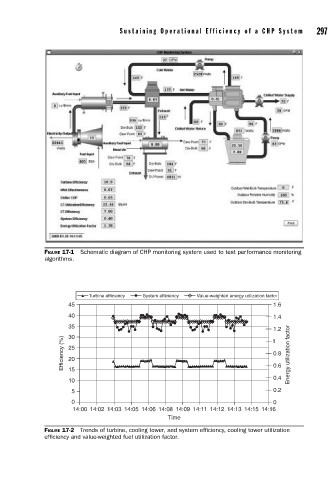
             FIGURE 17-1  Schematic diagram of CHP monitoring system used to test performance monitoring
             algorithms.


                          Turbine efficiency  System efficiency  Value-weighted energy utilization factor
                    45                                                       1.6
                    40                                                       1.4
                    35
                                                                             1.2
                    30
                  Efficiency (%)  25                                         1 0.8 Energy utilization factor

                    20
                                                                             0.6
                    15
                                                                             0.4
                    10
                     5                                                       0.2
                     0                                                       0
                     14:00 14:02 14:03 14:05 14:06 14:08 14:09 14:11 14:12 14:13 14:15 14:16
                                                Time
             FIGURE 17-2  Trends of turbine, cooling tower, and system effi ciency, cooling tower utilization
             effi ciency and value-weighted fuel utilization factor.
   319   320   321   322   323   324   325   326   327   328   329