
Page 325 - Sustainable On-Site CHP Systems Design, Construction, and Operations
P. 325
298 Op erations
1
0.9
0.8
0.7
Efficiency (%)/COP 0.6
0.5
0.4
HRU efficiency
0.3
Chiller COP
0.2
0.1
0
14:00 14:02 14:03 14:05 14:06 14:08 14:09 14:11 14:12 14:13 14:15 14:16
Time
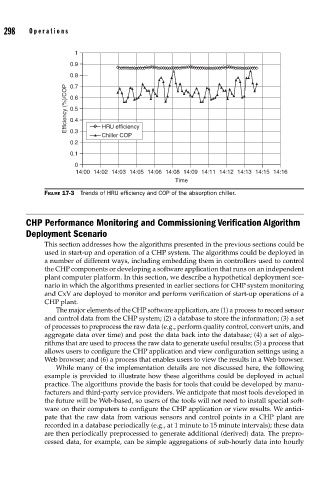
FIGURE 17-3 Trends of HRU effi ciency and COP of the absorption chiller.
CHP Performance Monitoring and Commissioning Verification Algorithm
Deployment Scenario
This section addresses how the algorithms presented in the previous sections could be
used in start-up and operation of a CHP system. The algorithms could be deployed in
a number of different ways, including embedding them in controllers used to control
the CHP components or developing a software application that runs on an independent
plant computer platform. In this section, we describe a hypothetical deployment sce-
nario in which the algorithms presented in earlier sections for CHP system monitoring
and CxV are deployed to monitor and perform verification of start-up operations of a
CHP plant.
The major elements of the CHP software application, are (1) a process to record sensor
and control data from the CHP system; (2) a database to store the information; (3) a set
of processes to preprocess the raw data (e.g., perform quality control, convert units, and
aggregate data over time) and post the data back into the database; (4) a set of algo-
rithms that are used to process the raw data to generate useful results; (5) a process that
allows users to configure the CHP application and view configuration settings using a
Web browser; and (6) a process that enables users to view the results in a Web browser.
While many of the implementation details are not discussed here, the following
example is provided to illustrate how these algorithms could be deployed in actual
practice. The algorithms provide the basis for tools that could be developed by manu-
facturers and third-party service providers. We anticipate that most tools developed in
the future will be Web-based, so users of the tools will not need to install special soft-
ware on their computers to configure the CHP application or view results. We antici-
pate that the raw data from various sensors and control points in a CHP plant are
recorded in a database periodically (e.g., at 1 minute to 15 minute intervals); these data
are then periodically preprocessed to generate additional (derived) data. The prepro-
cessed data, for example, can be simple aggregations of sub-hourly data into hourly