
Page 328 - Sustainable On-Site CHP Systems Design, Construction, and Operations
P. 328
Sustaining Operational Ef ficiency of a CHP System 301
Time 13:00 13:30 14:00 14:30 15:00
EUF 1.12 1.12 1.07 1.12 1.12
VW
η 0.59 0.59 0.54 0.59 0.59
F
η 0.27 0.27 0.27 0.27 0.27
EE
ε 0.63 0.63 0.54 0.62 0.63
HRU
COP 0.70 0.68 0.60 0.68 0.70
AbChiller
η 0.71 0.70 0.52 0.68 0.71
CT
η 7.0 7.0 3.5 6.5 7.0
CT, elec
η 0.65 0.65 0.65 0.65 0.65
Pump
Q Fuel,turbine 3703 3703 3703 3703 3703
= ρ LHV (kW)
Fuel v Fuel,Turbine Fuel
Q Fuel,aux 0 0 0 0 0
= ρ LHV (kW)
Fuel v Fuel,AuxiliaryHeat Fuel
W (kW) 1000 1000 1000 1000 1000
elec
Q (kW ) 1190 1180 1000 1185 1190
th th
T (°F) 620 620 620 620 620
Turbine, ex
T (°F) 45.0 45.0 48.0 46.0 45.0
evap,w,o
T (°F) 55.0 55.0 58.0 56.0 55.0
evap,w,i
T (°F) 239 239 247 241 239
HRU,w,i
T (°F) 257 257 258 257 257
HRU,w,o
T (°F) 95 96 102 96 95
CT,w,i
T (°F) 80 81 88 82 80
CT,w,o
T (°F) 74 75 75 75 74
wb
T − T (°F) 6 6 13 7 6
CT,w,o wb
T − T (°F) 15 15 14 14 15
CT,w,i CT,w,o
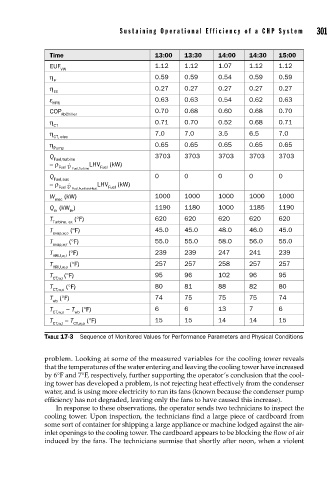
TABLE 17-3 Sequence of Monitored Values for Performance Parameters and Physical Conditions
problem. Looking at some of the measured variables for the cooling tower reveals
that the temperatures of the water entering and leaving the cooling tower have increased
by 6°F and 7°F, respectively, further supporting the operator’s conclusion that the cool-
ing tower has developed a problem, is not rejecting heat effectively from the condenser
water, and is using more electricity to run its fans (known because the condenser pump
efficiency has not degraded, leaving only the fans to have caused this increase).
In response to these observations, the operator sends two technicians to inspect the
cooling tower. Upon inspection, the technicians find a large piece of cardboard from
some sort of container for shipping a large appliance or machine lodged against the air-
inlet openings to the cooling tower. The cardboard appears to be blocking the flow of air
induced by the fans. The technicians surmise that shortly after noon, when a violent