
Page 317 - Synthetic Fuels Handbook
P. 317
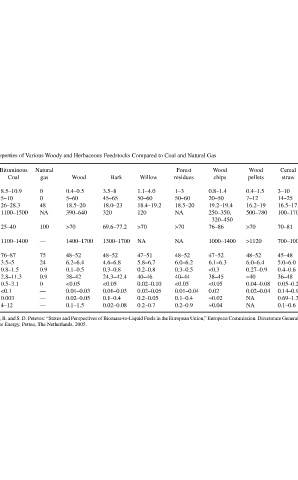
Dedicated  energy crops  6.2–7.5  15–20  17.1–17.5  200  >70  700–1200  45.5–46.1  5.7–5.8  0.50–1.0  41–44  0.08–0.13  0.09  0.3–0.5  9


                           Cereal  straw  3–10  14–25  16.5–17.4  100–170  70–81   700–1000  45–48  5.0–6.0  0.4–0.6   36–48  0.05–0.2   0.14–0.97   0.69–1.3  0.1–0.6


                           Wood  pellets  0.4–1.5  7–12  16.2–19  500–780  >70   >1120  48–52  6.0–6.4  0.27–0.9   ≈40  0.04–0.08   0.02–0.04   NA  NA


                           Wood  chips  0.8–1.4  20–50  19.2–19.4  250–350,  320–450  76–86   1000–1400  47–52  6.1–6.3  <0.3   38–45  <0.05   0.02   ≈0.02  ≈0.04
                       Properties of Various Woody and Herbaceous Feedstocks Compared to Coal and Natural Gas


                           Forest  residues  1–3  50–60  18.5–20  NA  >70   NA  48–52  6.0–6.2  0.3–0.5   40–44  <0.05   0.01–0.04   0.1–0.4   0.2–0.9


                             Willow  1.1–4.0  50–60  18.4–19.2  120  >70   NA  47–51  5.8–6.7  0.2–0.8   40–46  0.02–0.10   0.02–0.05   0.2–0.05   0.2–0.7  Source: Kavalov, B. and S. D. Peteves: “Status and Perspectives of Biomass-to-Liquid Fuels in the European Union,” European Commission. Directorate General Joint Research Centre


                             Bark         69.6–77.2   1300–1700  24.3–42.4  0.01–0.03   0.02–0.08
                                 3.5–8  45–65  18.0–23  320  48–52  4.6–6.8  0.3–0.8   <0.05   0.1–0.4


                             Wood  0.4–0.5  5–60  18.5–20  390–640  >70   1400–1700  48–52  6.2–6.4  0.1–0.5   38–42  <0.05   0.01–0.03   0.02–0.05   0.1–1.5


                           Natural  gas  0  0  48  NA  100   —  75  24  0.9   0.9  0   —   —   —


                           Bituminous  Coal  8.5–10.9  5–10  26–28.3  1100–1500  25–40   1100–1400  76–87  3.5–5  0.8–1.5   2.8–11.3  0.5–3.1   <0.1   0.003   4–12  (DGJRC), Institute for Energy, Petten, The Netherlands, 2005.


                       TABLE 10.1   d%  Ash,  w% Moisture,  MJ/kg  NCV,  Density,   kg/m 3  Volatile    w%  matter,  melting  Ash   point, T°C  d%  C,  d%  H,  N, d%   d%  O,  S, d%   Cl, d%   K, d%   Ca, d%


                                            303