
Page 319 - Synthetic Fuels Handbook
P. 319
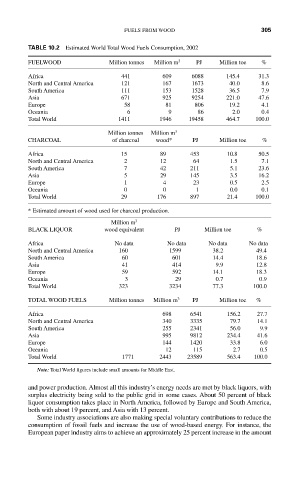
FUELS FROM WOOD                      305

             TABLE 10.2  Estimated World Total Wood Fuels Consumption, 2002
             FUELWOOD             Million tonnes  Million m 3  PJ  Million toe  %

             Africa                   441        609    6088      145.4   31.3
             North and Central America   121     167    1673      40.0     8.6
             South America            111        153    1528      36.5     7.9
             Asia                     671        925    9254      221.0   47.6
             Europe                   58         81      806      19.2     4.1
             Oceania                   6          9       86       2.0     0.4
             Total World             1411       1946    19458     464.7   100.0
                                  Million tonnes   Million m 3
             CHARCOAL              of charcoal   wood*   PJ     Million toe   %
             Africa                   15        89      453       10.8    50.5
             North and Central America   2      12       64        1.5     7.1
             South America            7         42      211        5.1    23.6
             Asia                     5         29      145        3.5    16.2
             Europe                   1          4       23        0.5     2.5
             Oceania                  0          0        1        0.0     0.1
             Total World              29       176      897       21.4   100.0
             * Estimated amount of wood used for charcoal production.
                                   Million m 3
             BLACK LIQUOR        wood equivalent    PJ      Million toe   %

             Africa                 No data       No data    No data    No data
             North and Central America   160      1599        38.2        49.4
             South America            60           601        14.4        18.6
             Asia                     41           414         9.9        12.8
             Europe                   59           592        14.1        18.3
             Oceania                   3            29         0.7        0.9
             Total World             323          3234        77.3       100.0
             TOTAL WOOD FUELS     Million tonnes   Million m 3  PJ  Million toe  %
             Africa                              698    6541      156.2   27.7
             North and Central America           340    3335       79.7   14.1
             South America                       255    2341       56.0    9.9
             Asia                                995    9812      234.4   41.6
             Europe                              144    1420       33.8    6.0
             Oceania                             12      115       2.7     0.5
             Total World              1771      2443   23589      563.4   100.0
               Note: Total World figures include small amounts for Middle East.

             and power production. Almost all this industry’s energy needs are met by black liquors, with
             surplus electricity being sold to the public grid in some cases. About 50 percent of black
             liquor consumption takes place in North America, followed by Europe and South America,
             both with about 19 percent, and Asia with 13 percent.
               Some industry associations are also making special voluntary contributions to reduce the
             consumption of fossil fuels and increase the use of wood-based energy. For instance, the
             European paper industry aims to achieve an approximately 25 percent increase in the amount