
Page 237 -
P. 237
204 Part 3 • the analysis Process
®
HYPERCASE EXPERIENCE 7
“You take a very interesting approach to the problems we have HYPERCASE Questions
here at MRE. I’ve seen you sketching diagrams of our operation 1. Find the data flow diagrams already drawn in MRE. Make a
almost since the day you walked in the door. I’m actually getting list of those you found and add a column to show where in
used to seeing you doodling away now. What did you call those? the organization you found them.
Oh, yes. Context-level diagrams. And flow networks? Oh, no. Data 2. Draw a context-level diagram to model the Training Unit
flow diagrams. That’s it, isn’t it?” Project Development process, one that is based on interviews
with relevant Training Unit staff. Then draw a level 0 dia-
gram that details the process.
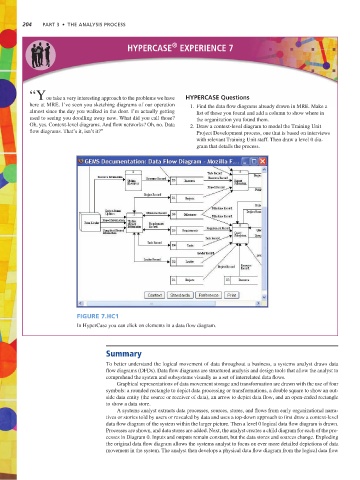
Figure 7.HC1
In HyperCase you can click on elements in a data flow diagram.
Summary
To better understand the logical movement of data throughout a business, a systems analyst draws data
flow diagrams (DFDs). Data flow diagrams are structured analysis and design tools that allow the analyst to
comprehend the system and subsystems visually as a set of interrelated data flows.
Graphical representations of data movement storage and transformation are drawn with the use of four
symbols: a rounded rectangle to depict data processing or transformations, a double square to show an out-
side data entity (the source or receiver of data), an arrow to depict data flow, and an open-ended rectangle
to show a data store.
A systems analyst extracts data processes, sources, stores, and flows from early organizational narra-
tives or stories told by users or revealed by data and uses a top-down approach to first draw a context-level
data flow diagram of the system within the larger picture. Then a level 0 logical data flow diagram is drawn.
Processes are shown, and data stores are added. Next, the analyst creates a child diagram for each of the pro-
cesses in Diagram 0. Inputs and outputs remain constant, but the data stores and sources change. Exploding
the original data flow diagram allows the systems analyst to focus on ever more detailed depictions of data
movement in the system. The analyst then develops a physical data flow diagram from the logical data flow