
Page 239 -
P. 239
206 Part 3 • the analysis Process
b. It takes some effort to educate users about data flow diagrams. Is it worthwhile to share DFDs
with users? Why or why not? Defend your response in a paragraph.
c. Compare data flow diagrams to use cases and use case scenarios. What do data flow diagrams
show that use case diagrams have a difficult time trying to explain?
2. Your latest project is to combine two systems used by Producers Financial. Angie Schworer’s loan
application system is fairly new, but has no documentation. Scott Wittman’s loan management sys-
tem is older and needs much revision, and the records are coded and kept independently of the other
system. The loan application system accepts applications, processes them, and recommends loans
for approval. The loan management system takes loans that have been approved and follows them
through their final disposition (paid, sold, or defaulted). Draw a context diagram and a level 1 data
flow diagram that show what an idealized combined system would look like.
3. One common experience that students in every college and university share is enrolling in a college
course.
a. Draw a level 1 data flow diagram of data movement for enrollment in a college course. Use a
single sheet and label each data item clearly.
b. Explode one of the processes in your original data flow diagram into subprocesses, adding data
flows and data stores.
c. List the parts of the enrollment process that are “hidden” to the outside observer and about which
you have had to make assumptions to complete a second-level diagram.
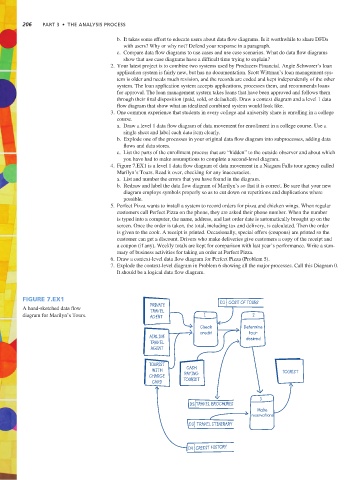
4. Figure 7.EX1 is a level 1 data flow diagram of data movement in a Niagara Falls tour agency called
Marilyn’s Tours. Read it over, checking for any inaccuracies.
a. List and number the errors that you have found in the diagram.
b. Redraw and label the data flow diagram of Marilyn’s so that it is correct. Be sure that your new
diagram employs symbols properly so as to cut down on repetitions and duplications where
possible.
5. Perfect Pizza wants to install a system to record orders for pizza and chicken wings. When regular
customers call Perfect Pizza on the phone, they are asked their phone number. When the number
is typed into a computer, the name, address, and last order date is automatically brought up on the
screen. Once the order is taken, the total, including tax and delivery, is calculated. Then the order
is given to the cook. A receipt is printed. Occasionally, special offers (coupons) are printed so the
customer can get a discount. Drivers who make deliveries give customers a copy of the receipt and
a coupon (if any). Weekly totals are kept for comparison with last year’s performance. Write a sum-
mary of business activities for taking an order at Perfect Pizza.
6. Draw a context-level data flow diagram for Perfect Pizza (Problem 5).
7. Explode the context-level diagram in Problem 6 showing all the major processes. Call this Diagram 0.
It should be a logical data flow diagram.
Figure 7.eX1
PRIVATE D1 COST OF TOURS
A hand-sketched data flow TRAVEL
diagram for Marilyn’s Tours. AGENT 1 2
Check Determine
credit tour
AIRLINE desired
TRAVEL
AGENT
TOURIST
WITH CASH TOURIST
CHARGE PAYING
CARD TOURIST
3
D2 TRAVEL BROCHURES
Make
reservations
D3 TRAVEL ITINERARY
D4 CREDIT HISTORY