
Page 255 -
P. 255
222 Part 3 • the analysis Process
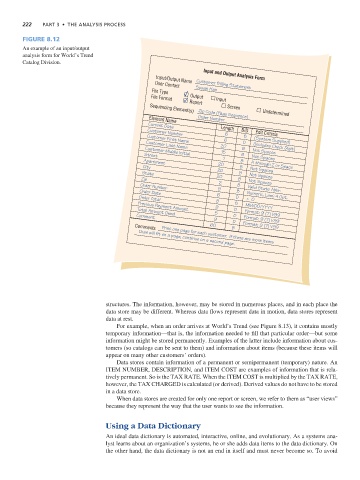
Figure 8.12
An example of an input/output
analysis form for World’s Trend
Catalog Division.
User Contact Input and Output Analysis Form
Input/Output Name Customer Billing Statement
Susan Han
File Type
Output
File Format Input
Report
Screen
Sequencing Element(s)
Undetermined
Zip Code (Page Sequence)
Order Number
Element Name
Current Date
Length B/D
6 B Edit Criteria
Customer Number
6 D (System Supplied)
Customer First Name
20 B (Includes Check Digit)
Customer Last Name
15 Not Spaces
Customer Middle Initial
Street B
1 Not Spaces
Apartment B
City 20 B A through Z or Space
20 Not Spaces
State B
Zip 20 B Not Spaces
2 Not Spaces
Order Number B
9 Valid State Abbr.
Order Date B
6 Numeric, Last 4 Opt.
Order Total D > 0
8 B
9 D MM/DD/YYYY
Previous Payment Amount
5 Format: 9 (7) V99
Total Amount Owed
Comment D
9 D Format: 9 (7) V99
60 Format; 9 (7) V99
B
Comments Print one page for each customer. If there are more items
than will fit on a page, continue on a second page.
structures. The information, however, may be stored in numerous places, and in each place the
data store may be different. Whereas data flows represent data in motion, data stores represent
data at rest.
For example, when an order arrives at World’s Trend (see Figure 8.13), it contains mostly
temporary information—that is, the information needed to fill that particular order—but some
information might be stored permanently. Examples of the latter include information about cus-
tomers (so catalogs can be sent to them) and information about items (because these items will
appear on many other customers’ orders).
Data stores contain information of a permanent or semipermanent (temporary) nature. An
ITEM NUMBER, DESCRIPTION, and ITEM COST are examples of information that is rela-
tively permanent. So is the TAX RATE. When the ITEM COST is multiplied by the TAX RATE,
however, the TAX CHARGED is calculated (or derived). Derived values do not have to be stored
in a data store.
When data stores are created for only one report or screen, we refer to them as “user views”
because they represent the way that the user wants to see the information.
Using a Data Dictionary
An ideal data dictionary is automated, interactive, online, and evolutionary. As a systems ana-
lyst learns about an organization’s systems, he or she adds data items to the data dictionary. On
the other hand, the data dictionary is not an end in itself and must never become so. To avoid