
Page 24 - TPM A Route to World-Class Performance
P. 24
TPM-from total productive maintenance to total productive manufacturing 5
45% ‘Value Chain’ OEE: 16 Losses (80%)
7
4 I
Line or factory
Suppliers Customers
I c c------l
65% M/C OEE (90%)
Floor-to-floor
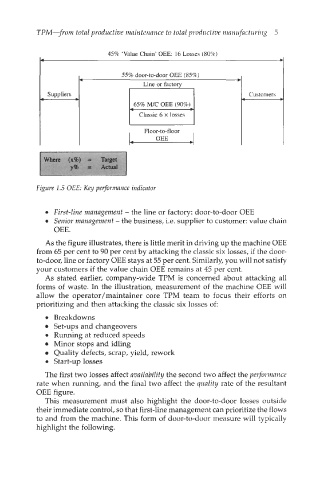
Figure 1.5 OEE: Key performance indicator
0 First-line management - the line or factory: door-to-door OEE
0 Senior management - the business, i.e. supplier to customer: value chain
OEE.
As the figure illustrates, there is little merit in driving up the machine OEE
from 65 per cent to 90 per cent by attacking the classic six losses, if the door-
to-door, line or factory OEE stays at 55 per cent. Similarly, you will not satisfy
your customers if the value chain OEE remains at 45 per cent.
As stated earlier, company-wide TPM is concerned about attacking all
forms of waste. In the illustration, measurement of the machine OEE will
allow the operator/maintainer core TPM team to focus their efforts on
prioritizing and then attacking the classic six losses of
0 Breakdowns
Set-ups and changeovers
0 Running at reduced speeds
Minor stops and idling
Quality defects, scrap, yield, rework
0 Start-up losses
The first two losses affect availability the second two affect the performance
rate when running, and the final two affect the quality rate of the resultant
OEE figure.
This measurement must also highlight the door-to-door losses outside
their immediate control, so that first-line management can prioritize the flows
to and from the machine. This form of door-to-door measure will typically
highlight the following.