
Page 28 - TPM A Route to World-Class Performance
P. 28
TPM-from total productive maintenance to total productive manufacturing 9
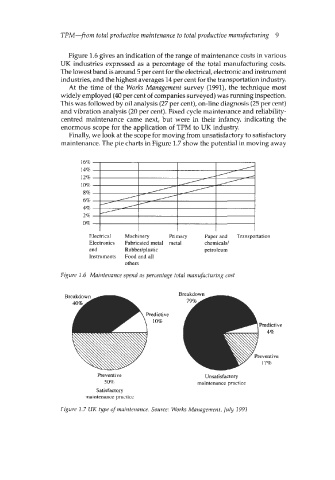
Figure 1.6 gives an indication of the range of maintenance costs in various
UK industries expressed as a percentage of the total manufacturing costs.
The lowest band is around 5 per cent for the electrical, electronic and instrument
industries, and the highest averages 14 per cent for the transportation industry.
At the time of the Works Management survey (1991), the technique most
widely employed (40 per cent of companies surveyed) was running inspection.
This was followed by oil analysis (27 per cent), on-line diagnosis (25 per cent)
and vibration analysis (20 per cent). Fixed cycle maintenance and reliability-
centred maintenance came next, but were in their infancy, indicating the
enormous scope for the application of TPM to UK industry.
Finally, we look at the scope for moving from unsatisfactory to satisfactory
maintenance. The pie charts in Figure 1.7 show the potential in moving away
16%
14%
12%
10%
8%
6%
4%
2%
0%
Electrical Machinery Primary Paper and Transportation
Electronics Fabricated metal metal chemicals/
and Rubbedplastic petroleum
Instruments Food and all
others
Figure 1.6 Maintenance spend as percentage total manufacturing cost
edictive
10%
Preventive Unsatisfactory
50% maintenance practice
Satisfactory
maintenance practice
Figure 1.7 UK type of maintenance. Source: Works Management, July 1991