
Page 27 - TPM A Route to World-Class Performance
P. 27
8 TPM-A Route to World-Class Performance
maintenance team would take great pride in its ability to ’fix’ a breakdown or
failure in minimum time, working overnight or at weekends and achieving
the seemingly impossible. Specialized spares and replacements would be
held in stock or squirrelled away in anticipation of breakdowns.
In the period after the Second World War this concept of breakdown
maintenance prevailed. It was not until the 1960s that fixed interval overhaul
became popular; this entailed maintenance intervention every three months
or after producing 50 000 units or running 500 hours or 20 000 miles. The
limitation of the regular interval approach is that it assumes that every machine
element will perform in a stable, consistent manner. However, in practical
situations this does not necessarily apply. There is also the well-known
syndrome of trouble after overhaul: a machine which is performing satisfactorily
may be disturbed by maintenance work, and some minor variation or defect
in reassembly can lead to subsequent problems.
It is interesting to consider some statistics of actual maintenance performance
in the early 1990s. Much of the material quoted below has been derived from
a survey carried out by the journal Works Munugemenf based on a sample of
407 companies in 1991.
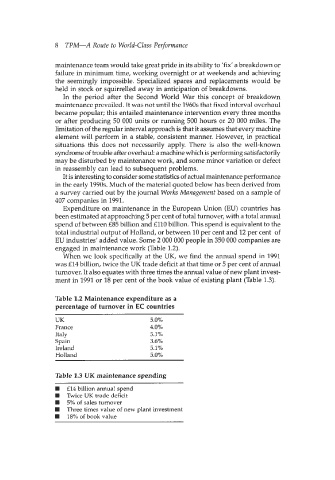
Expenditure on maintenance in the European Union (EU) countries has
been estimated at approaching 5 per cent of total turnover, with a total annual
spend of between €85 billion and €110 billion. This spend is equivalent to the
total industrial output of Holland, or between 10 per cent and 12 per cent of
EU industries’ added value. Some 2 000 000 people in 350 000 companies are
engaged in maintenance work (Table 1.2).
When we look specifically at the UK, we find the annual spend in 1991
was €14 billion, twice the UK trade deficit at that time or 5 per cent of annual
turnover. It also equates with three times the annual value of new plant invest-
ment in 1991 or 18 per cent of the book value of existing plant (Table 1.3).
Table 1.2 Maintenance expenditure as a
percentage of turnover in EC countries
UK 5.0%
France 4.0%
Italy 5.1%
Spain 3.6%
Ireland 5.1%
Holland 5.0%
~~~
Table 1.3 UK maintenance spending
W €14 billion annual spend
W Twice UK trade deficit
W 5% of sales turnover
Three times value of new plant investment
W 18% of book value