
Page 146 - Tandem Techniques
P. 146
Page 127
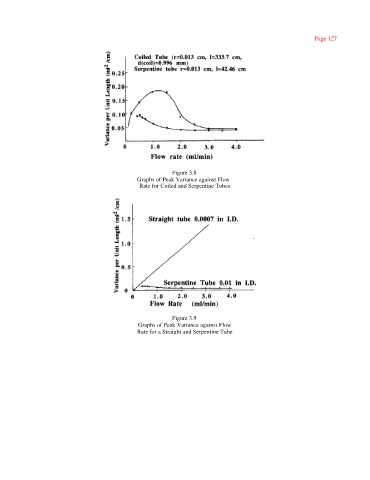
Figure 3.8
Graphs of Peak Variance against Flow
Rate for Coiled and Serpentine Tubes
Figure 3.9
Graphs of Peak Variance against Flow
Rate for a Straight and Serpentine Tube