
Page 277 - Tandem Techniques
P. 277
Page 261
peak tail contains an impurity, as the clean rectangular shape of the other peaks is not realized. The
absorption ratio peaks are shown in Figure 7.4. The ratio peaks in Figure 7.4, confirm the presence of
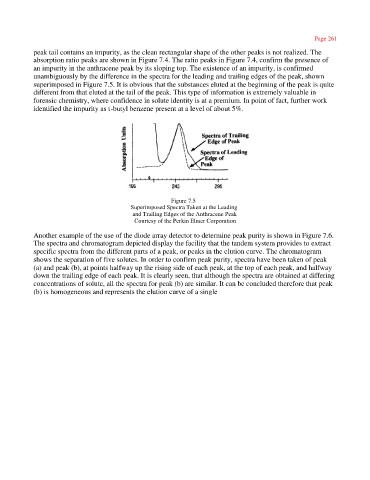
an impurity in the anthracene peak by its sloping top. The existence of an impurity, is confirmed
unambiguously by the difference in the spectra for the leading and trailing edges of the peak, shown
superimposed in Figure 7.5. It is obvious that the substances eluted at the beginning of the peak is quite
different from that eluted at the tail of the peak. This type of information is extremely valuable in
forensic chemistry, where confidence in solute identity is at a premium. In point of fact, further work
identified the impurity as t-butyl benzene present at a level of about 5%.
Figure 7.5
Superimposed Spectra Taken at the Leading
and Trailing Edges of the Anthracene Peak
Courtesy of the Perkin Elmer Corporation
Another example of the use of the diode array detector to determine peak purity is shown in Figure 7.6.
The spectra and chromatogram depicted display the facility that the tandem system provides to extract
specific spectra from the different parts of a peak, or peaks in the elution curve. The chromatogram
shows the separation of five solutes. In order to confirm peak purity, spectra have been taken of peak
(a) and peak (b), at points halfway up the rising side of each peak, at the top of each peak, and halfway
down the trailing edge of each peak. It is clearly seen, that although the spectra are obtained at differing
concentrations of solute, all the spectra for peak (b) are similar. It can be concluded therefore that peak
(b) is homogeneous and represents the elution curve of a single