
Page 288 - Tandem Techniques
P. 288
Page 272
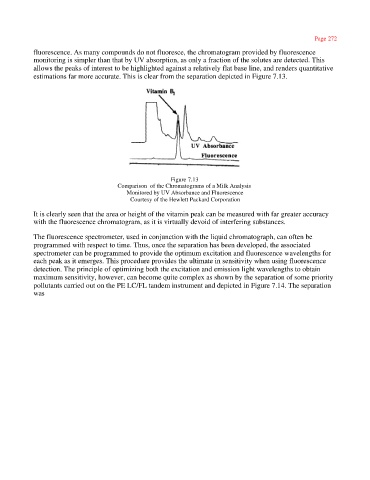
fluorescence. As many compounds do not fluoresce, the chromatogram provided by fluorescence
monitoring is simpler than that by UV absorption, as only a fraction of the solutes are detected. This
allows the peaks of interest to be highlighted against a relatively flat base line, and renders quantitative
estimations far more accurate. This is clear from the separation depicted in Figure 7.13.
Figure 7.13
Comparison of the Chromatograms of a Milk Analysis
Monitored by UV Absorbance and Fluorescence
Courtesy of the Hewlett Packard Corporation
It is clearly seen that the area or height of the vitamin peak can be measured with far greater accuracy
with the fluorescence chromatogram, as it is virtually devoid of interfering substances.
The fluorescence spectrometer, used in conjunction with the liquid chromatograph, can often be
programmed with respect to time. Thus, once the separation has been developed, the associated
spectrometer can be programmed to provide the optimum excitation and fluorescence wavelengths for
each peak as it emerges. This procedure provides the ultimate in sensitivity when using fluorescence
detection. The principle of optimizing both the excitation and emission light wavelengths to obtain
maximum sensitivity, however, can become quite complex as shown by the separation of some priority
pollutants carried out on the PE LC/FL tandem instrument and depicted in Figure 7.14. The separation
was