
Page 290 - Tandem Techniques
P. 290
Page 274
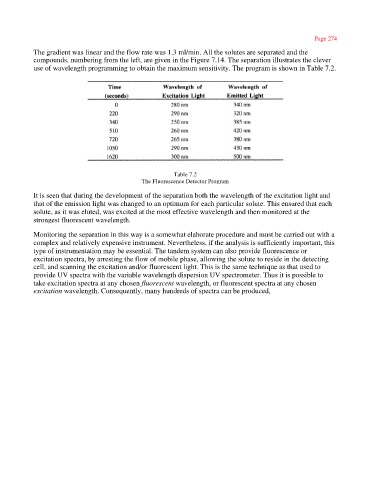
The gradient was linear and the flow rate was 1.3 ml/min. All the solutes are separated and the
compounds, numbering from the left, are given in the Figure 7.14. The separation illustrates the clever
use of wavelength programming to obtain the maximum sensitivity. The program is shown in Table 7.2.
Table 7.2
The Fluorescence Detector Program
It is seen that during the development of the separation both the wavelength of the excitation light and
that of the emission light was changed to an optimum for each particular solute. This ensured that each
solute, as it was eluted, was excited at the most effective wavelength and then monitored at the
strongest fluorescent wavelength.
Monitoring the separation in this way is a somewhat elaborate procedure and must be carried out with a
complex and relatively expensive instrument. Nevertheless, if the analysis is sufficiently important, this
type of instrumentation may be essential. The tandem system can also provide fluorescence or
excitation spectra, by arresting the flow of mobile phase, allowing the solute to reside in the detecting
cell, and scanning the excitation and/or fluorescent light. This is the same technique as that used to
provide UV spectra with the variable wavelength dispersion UV spectrometer. Thus it is possible to
take excitation spectra at any chosen fluorescent wavelength, or fluorescent spectra at any chosen
excitation wavelength. Consequently, many hundreds of spectra can be produced,