
Page 478 - Tandem Techniques
P. 478
Page 463
The measuring points were taken as averages from consecutive sample pairs and the scan was taken
over a period of 80 minutes. Nevertheless, a very respectable chromatogram is achieved, from which
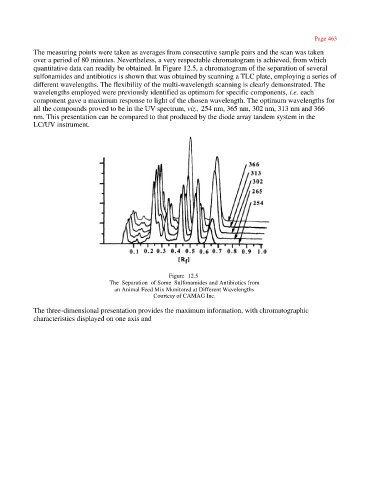
quantitative data can readily be obtained. In Figure 12.5, a chromatogram of the separation of several
sulfonamides and antibiotics is shown that was obtained by scanning a TLC plate, employing a series of
different wavelengths. The flexibility of the multi-wavelength scanning is clearly demonstrated. The
wavelengths employed were previously identified as optimum for specific components, i.e. each
component gave a maximum response to light of the chosen wavelength. The optimum wavelengths for
all the compounds proved to be in the UV spectrum, viz., 254 nm, 365 nm, 302 nm, 313 nm and 366
nm. This presentation can be compared to that produced by the diode array tandem system in the
LC/UV instrument.
Figure 12.5
The Separation of Some Sulfonamides and Antibiotics from
an Animal Feed Mix Monitored at Different Wavelengths
Courtesy of CAMAG Inc.
The three-dimensional presentation provides the maximum information, with chromatographic
characteristics displayed on one axis and