
Page 72 - Tandem Techniques
P. 72
Page 53
a lens through the flow cell. The exit beam from the cell is focused onto a photo-cell which gives a
response that is some function of the intensity of the transmitted light. The wavelength is scanned by
rotating the plane mirror. The output from the photocell, electronically modified and presented on a
chart recorder or computer printer, will provide an adsorption curve relating adsorption to wavelength
(or frequency). The adsorption curve is known as the adsorption spectrum and its shape will be
characteristic for the substance being examined.
The Diode Array UV/Visible Spectrometer
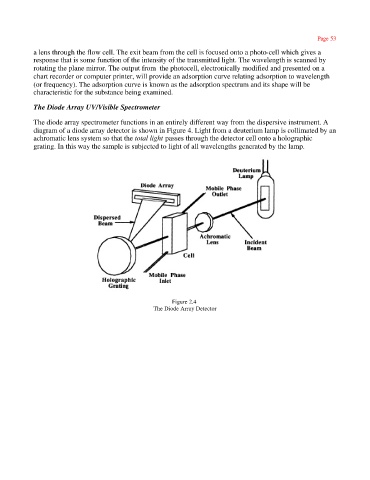
The diode array spectrometer functions in an entirely different way from the dispersive instrument. A
diagram of a diode array detector is shown in Figure 4. Light from a deuterium lamp is collimated by an
achromatic lens system so that the total light passes through the detector cell onto a holographic
grating. In this way the sample is subjected to light of all wavelengths generated by the lamp.
Figure 2.4
The Diode Array Detector