
Page 93 - The Art of Designing Embedded Systems
P. 93
80 THE ART OF DESIGNING EMBEDDED SYSTEMS
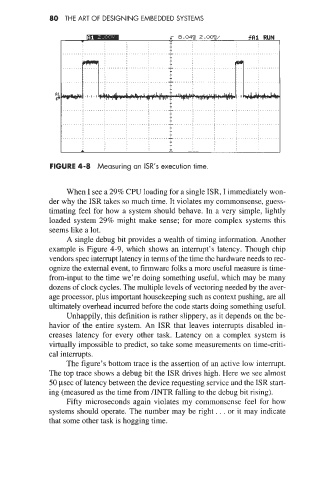
FIGURE 4-8 Measuring an ISR’s execution time.
When I see a 29% CPU loading for a single ISR, I immediately won-
der why the ISR takes so much time. It violates my commonsense, guess-
timating feel for how a system should behave. In a very simple, lightly
loaded system 29% might make sense; for more complex systems this
seems like a lot.
A single debug bit provides a wealth of timing information. Another
example is Figure 4-9, which shows an interrupt’s latency. Though chip
vendors spec interrupt latency in terms of the time the hardware needs to rec-
ognize the external event, to firmware folks a more useful measure is time-
from-input to the time we’re doing something useful, which may be many
dozens of clock cycles. The multiple levels of vectoring needed by the aver-
age processor, plus important housekeeping such as context pushing, are all
ultimately overhead incurred before the code starts doing something useful.
Unhappily, this definition is rather slippery, as it depends on the be-
havior of the entire system. An ISR that leaves interrupts disabled in-
creases latency for every other task. Latency on a complex system is
virtually impossible to predict, so take some measurements on time-criti-
cal interrupts.
The figure’s bottom trace is the assertion of an active low interrupt.
The top trace shows a debug bit the ISR drives high. Here we see almost
50 psec of latency between the device requesting service and the ISR start-
ing (measured as the time from /INTR falling to the debug bit rising).
Fifty microseconds again violates my commonsense feel for how
systems should operate. The number may be right. . . or it may indicate
that some other task is hogging time.