
Page 94 - The Art of Designing Embedded Systems
P. 94
Real Time Means Right Now! 81
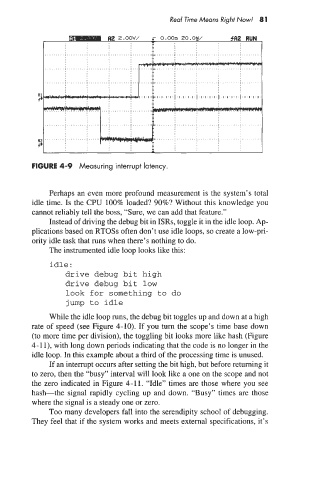
FIGURE 4-9 Measuring interrupt latency.
Perhaps an even more profound measurement is the system’s total
idle time. Is the CPU 100% loaded? 90%? Without this knowledge you
cannot reliably tell the boss, “Sure, we can add that feature.”
Instead of driving the debug bit in ISRs, toggle it in the idle loop. Ap-
plications based on RTOSs often don’t use idle loops, so create a low-pri-
ority idle task that runs when there’s nothing to do.
The instrumented idle loop looks like this:
idle :
drive debug bit high
drive debug bit low
look for something to do
jump to idle
While the idle loop runs, the debug bit toggles up and down at a high
rate of speed (see Figure 4-10). If you turn the scope’s time base down
(to more time per division), the toggling bit looks more like hash (Figure
4-1 l), with long down periods indicating that the code is no longer in the
idle loop. In this example about a third of the processing time is unused.
If an interrupt occurs after setting the bit high, but before returning it
to zero, then the “busy” interval will look like a one on the scope and not
the zero indicated in Figure 4-11. “Idle” times are those where you see
hash-the signal rapidly cycling up and down. “Busy” times are those
where the signal is a steady one or zero.
Too many developers fall into the serendipity school of debugging.
They feel that if the system works and meets external specifications, it’s