
Page 146 - Bruce Ellig - The Complete Guide to Executive Compensation (2007)
P. 146
132 The Complete Guide to Executive Compensation
Milestone Date Percent Gain
100 (inception) February 1971 —
500 April 1991 400
1000 July 1995 100
2000 July 1998 100
3000 November 1999 50
4000 December 1999 33
5000 March 2000 25
Table 4-11. NASDAQ milestones
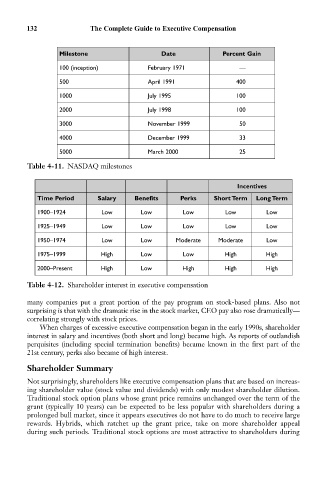
Incentives
Time Period Salary Benefits Perks Short Term Long Term
1900–1924 Low Low Low Low Low
1925–1949 Low Low Low Low Low
1950–1974 Low Low Moderate Moderate Low
1975–1999 High Low Low High High
2000–Present High Low High High High
Table 4-12. Shareholder interest in executive compensation
many companies put a great portion of the pay program on stock-based plans. Also not
surprising is that with the dramatic rise in the stock market, CEO pay also rose dramatically—
correlating strongly with stock prices.
When charges of excessive executive compensation began in the early 1990s, shareholder
interest in salary and incentives (both short and long) became high. As reports of outlandish
perquisites (including special termination benefits) became known in the first part of the
21st century, perks also became of high interest.
Shareholder Summary
Not surprisingly, shareholders like executive compensation plans that are based on increas-
ing shareholder value (stock value and dividends) with only modest shareholder dilution.
Traditional stock option plans whose grant price remains unchanged over the term of the
grant (typically 10 years) can be expected to be less popular with shareholders during a
prolonged bull market, since it appears executives do not have to do much to receive large
rewards. Hybrids, which ratchet up the grant price, take on more shareholder appeal
during such periods. Traditional stock options are most attractive to shareholders during