
Page 153 - Bruce Ellig - The Complete Guide to Executive Compensation (2007)
P. 153
Chapter 4. The Stakeholders 139
With the average worker at the time earning about $1,000 a year, it was considered a reflec-
tion of being somewhat well off if you had to pay a tax. Reportedly, some 350,000 individuals
were entitled to such bragging rights. The form along with payment was due March 1, along
with an in-person affirmation of the truthfulness of the tax return. Since reportedly all returns
were audited, it was important to be both truthful and accurate, just as it is today even though
the percentage of returns audited has dropped.
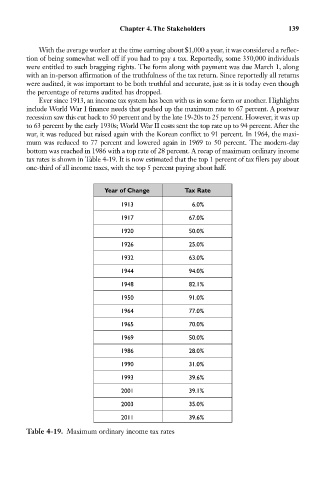
Ever since 1913, an income tax system has been with us in some form or another. Highlights
include World War I finance needs that pushed up the maximum rate to 67 percent. A postwar
recession saw this cut back to 50 percent and by the late 19-20s to 25 percent. However, it was up
to 63 percent by the early 1930s; World War II costs sent the top rate up to 94 percent. After the
war, it was reduced but raised again with the Korean conflict to 91 percent. In 1964, the maxi-
mum was reduced to 77 percent and lowered again in 1969 to 50 percent. The modern-day
bottom was reached in 1986 with a top rate of 28 percent. A recap of maximum ordinary income
tax rates is shown in Table 4-19. It is now estimated that the top 1 percent of tax filers pay about
one-third of all income taxes, with the top 5 percent paying about half.
Year of Change Tax Rate
1913 6.0%
1917 67.0%
1920 50.0%
1926 25.0%
1932 63.0%
1944 94.0%
1948 82.1%
1950 91.0%
1964 77.0%
1965 70.0%
1969 50.0%
1986 28.0%
1990 31.0%
1993 39.6%
2001 39.1%
2003 35.0%
2011 39.6%
Table 4-19. Maximum ordinary income tax rates