
Page 196 - Bruce Ellig - The Complete Guide to Executive Compensation (2007)
P. 196
182 The Complete Guide to Executive Compensation
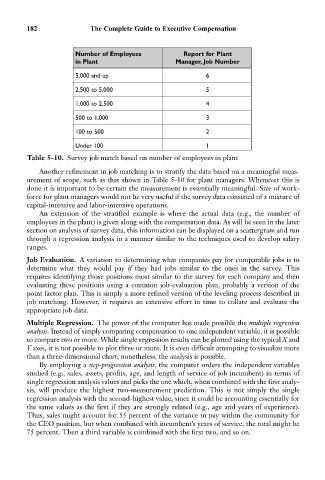
Number of Employees Report for Plant
in Plant Manager, Job Number
5,000 and up 6
2,500 to 5,000 5
1,000 to 2,500 4
500 to 1,000 3
100 to 500 2
Under 100 1
Table 5-10. Survey job match based on number of employees in plant
Another refinement in job matching is to stratify the data based on a meaningful meas-
urement of scope, such as that shown in Table 5-10 for plant managers. Whenever this is
done it is important to be certain the measurement is essentially meaningful. Size of work-
force for plant managers would not be very useful if the survey data consisted of a mixture of
capital-intensive and labor-intensive operations.
An extension of the stratified example is where the actual data (e.g., the number of
employees in the plant) is given along with the compensation data. As will be seen in the later
section on analysis of survey data, this information can be displayed on a scattergram and run
through a regression analysis in a manner similar to the techniques used to develop salary
ranges.
Job Evaluation. A variation to determining what companies pay for comparable jobs is to
determine what they would pay if they had jobs similar to the ones in the survey. This
requires identifying those positions most similar to the survey for each company and then
evaluating these positions using a common job-evaluation plan, probably a version of the
point factor plan. This is simply a more refined version of the leveling process described in
job matching. However, it requires an extensive effort in time to collate and evaluate the
appropriate job data.
Multiple Regression. The power of the computer has made possible the multiple regression
analysis. Instead of simply comparing compensation to one independent variable, it is possible
to compare two or more. While single regression results can be plotted using the typical X and
Y axes, it is not possible to plot three or more. It is even difficult attempting to visualize more
than a three-dimensional chart; nonetheless, the analysis is possible.
By employing a step-progression analysis, the computer orders the independent variables
studied (e.g., sales, assets, profits, age, and length of service of job incumbent) in terms of
single regression analysis values and picks the one which, when combined with the first analy-
sis, will produce the highest two-measurement prediction. This is not simply the single
regression analysis with the second-highest value, since it could be accounting essentially for
the same values as the first if they are strongly related (e.g., age and years of experience).
Thus, sales might account for 55 percent of the variance in pay within the community for
the CEO position, but when combined with incumbent’s years of service, the total might be
75 percent. Then a third variable is combined with the first two, and so on.