
Page 200 - Bruce Ellig - The Complete Guide to Executive Compensation (2007)
P. 200
186 The Complete Guide to Executive Compensation
Compensation
(Thousands)
10,000
CEO Salary & S.T. Inc
Current Year
Last Year
2,000
1,000
A
B
C 200
100
0
1 50 100 500 1,000 5,000 10,000
Sales Volume (Million)
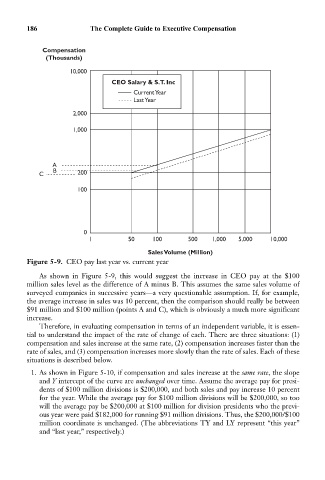
Figure 5-9. CEO pay last year vs. current year
As shown in Figure 5-9, this would suggest the increase in CEO pay at the $100
million sales level as the difference of A minus B. This assumes the same sales volume of
surveyed companies in successive years—a very questionable assumption. If, for example,
the average increase in sales was 10 percent, then the comparison should really be between
$91 million and $100 million (points A and C), which is obviously a much more significant
increase.
Therefore, in evaluating compensation in terms of an independent variable, it is essen-
tial to understand the impact of the rate of change of each. There are three situations: (1)
compensation and sales increase at the same rate, (2) compensation increases faster than the
rate of sales, and (3) compensation increases more slowly than the rate of sales. Each of these
situations is described below.
1. As shown in Figure 5-10, if compensation and sales increase at the same rate, the slope
and Y intercept of the curve are unchanged over time. Assume the average pay for presi-
dents of $100 million divisions is $200,000, and both sales and pay increase 10 percent
for the year. While the average pay for $100 million divisions will be $200,000, so too
will the average pay be $200,000 at $100 million for division presidents who the previ-
ous year were paid $182,000 for running $91 million divisions. Thus, the $200,000/$100
million coordinate is unchanged. (The abbreviations TY and LY represent “this year”
and “last year,” respectively.)