
Page 204 - Bruce Ellig - The Complete Guide to Executive Compensation (2007)
P. 204
190 The Complete Guide to Executive Compensation
Compensation
(Thousands)
$400
TY
LY
200
$100 $105 $200
Sales Volume (Millions)
Figure 5-15. Sales vs. compensation, TY lower but ascending
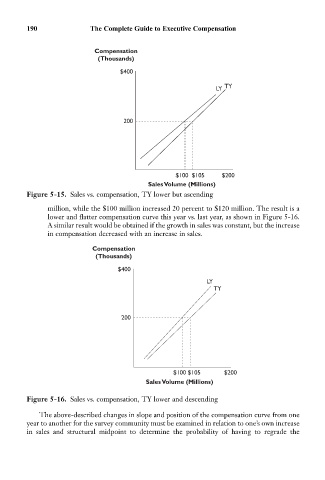
million, while the $100 million increased 20 percent to $120 million. The result is a
lower and flatter compensation curve this year vs. last year, as shown in Figure 5-16.
A similar result would be obtained if the growth in sales was constant, but the increase
in compensation decreased with an increase in sales.
Compensation
(Thousands)
$400
LY
TY
200
$100 $105 $200
Sales Volume (Millions)
Figure 5-16. Sales vs. compensation, TY lower and descending
The above-described changes in slope and position of the compensation curve from one
year to another for the survey community must be examined in relation to one’s own increase
in sales and structural midpoint to determine the probability of having to regrade the