
Page 205 - Bruce Ellig - The Complete Guide to Executive Compensation (2007)
P. 205
Chapter 5. Salary 191
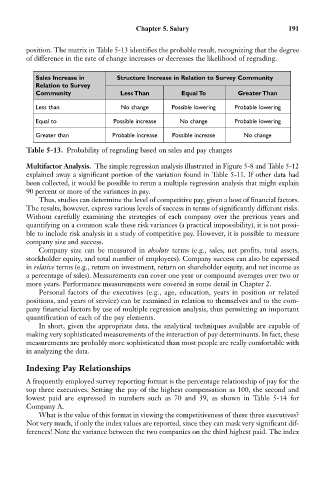
position. The matrix in Table 5-13 identifies the probable result, recognizing that the degree
of difference in the rate of change increases or decreases the likelihood of regrading.
Sales Increase in Structure Increase in Relation to Survey Community
Relation to Survey
Community Less Than Equal To Greater Than
Less than No change Possible lowering Probable lowering
Equal to Possible increase No change Probable lowering
Greater than Probable increase Possible increase No change
Table 5-13. Probability of regrading based on sales and pay changes
Multifactor Analysis. The simple regression analysis illustrated in Figure 5-8 and Table 5-12
explained away a significant portion of the variation found in Table 5-11. If other data had
been collected, it would be possible to rerun a multiple regression analysis that might explain
90 percent or more of the variances in pay.
Thus, studies can determine the level of competitive pay, given a host of financial factors.
The results, however, express various levels of success in terms of significantly different risks.
Without carefully examining the strategies of each company over the previous years and
quantifying on a common scale these risk variances (a practical impossibility), it is not possi-
ble to include risk analysis in a study of competitive pay. However, it is possible to measure
company size and success.
Company size can be measured in absolute terms (e.g., sales, net profits, total assets,
stockholder equity, and total number of employees). Company success can also be expressed
in relative terms (e.g., return on investment, return on shareholder equity, and net income as
a percentage of sales). Measurements can cover one year or compound averages over two or
more years. Performance measurements were covered in some detail in Chapter 2.
Personal factors of the executives (e.g., age, education, years in position or related
positions, and years of service) can be examined in relation to themselves and to the com-
pany financial factors by use of multiple regression analysis, thus permitting an important
quantification of each of the pay elements.
In short, given the appropriate data, the analytical techniques available are capable of
making very sophisticated measurements of the interaction of pay determinants. In fact, these
measurements are probably more sophisticated than most people are really comfortable with
in analyzing the data.
Indexing Pay Relationships
A frequently employed survey reporting format is the percentage relationship of pay for the
top three executives. Setting the pay of the highest compensation as 100, the second and
lowest paid are expressed in numbers such as 70 and 39, as shown in Table 5-14 for
Company A.
What is the value of this format in viewing the competitiveness of these three executives?
Not very much, if only the index values are reported, since they can mask very significant dif-
ferences! Note the variance between the two companies on the third highest paid. The index