
Page 206 - Bruce Ellig - The Complete Guide to Executive Compensation (2007)
P. 206
192 The Complete Guide to Executive Compensation
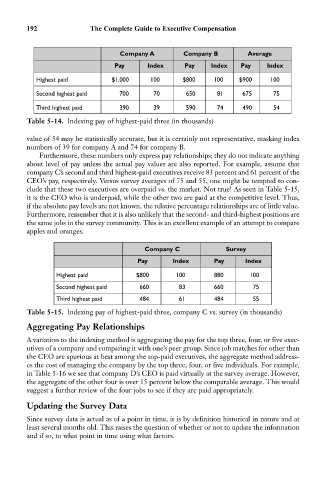
Company A Company B Average
Pay Index Pay Index Pay Index
Highest paid $1,000 100 $800 100 $900 100
Second highest paid 700 70 650 81 675 75
Third highest paid 390 39 590 74 490 54
Table 5-14. Indexing pay of highest-paid three (in thousands)
value of 54 may be statistically accurate, but it is certainly not representative, masking index
numbers of 39 for company A and 74 for company B.
Furthermore, these numbers only express pay relationships; they do not indicate anything
about level of pay unless the actual pay values are also reported. For example, assume that
company C’s second and third highest-paid executives receive 83 percent and 61 percent of the
CEO’s pay, respectively. Versus survey averages of 75 and 55, one might be tempted to con-
clude that these two executives are overpaid vs. the market. Not true! As seen in Table 5-15,
it is the CEO who is underpaid, while the other two are paid at the competitive level. Thus,
if the absolute pay levels are not known, the relative percentage relationships are of little value.
Furthermore, remember that it is also unlikely that the second- and third-highest positions are
the same jobs in the survey community. This is an excellent example of an attempt to compare
apples and oranges.
Company C Survey
Pay Index Pay Index
Highest paid $800 100 880 100
Second highest paid 660 83 660 75
Third highest paid 484 61 484 55
Table 5-15. Indexing pay of highest-paid three, company C vs. survey (in thousands)
Aggregating Pay Relationships
A variation to the indexing method is aggregating the pay for the top three, four, or five exec-
utives of a company and comparing it with one’s peer group. Since job matches for other than
the CEO are spurious at best among the top-paid executives, the aggregate method address-
es the cost of managing the company by the top three, four, or five individuals. For example,
in Table 5-16 we see that company D’s CEO is paid virtually at the survey average. However,
the aggregate of the other four is over 15 percent below the comparable average. This would
suggest a further review of the four jobs to see if they are paid appropriately.
Updating the Survey Data
Since survey data is actual as of a point in time, it is by definition historical in nature and at
least several months old. This raises the question of whether or not to update the information
and if so, to what point in time using what factors.